Cabela's 2005 Annual Report Download - page 52
Download and view the complete annual report
Please find page 52 of the 2005 Cabela's annual report below. You can navigate through the pages in the report by either clicking on the pages listed below, or by using the keyword search tool below to find specific information within the annual report.-
 1
1 -
2
-
3
-
4
-
5
-
6
-
7
-
8
-
9
-
10
-
11
-
12
-
13
-
14
-
15
-
16
-
17
-
18
-
19
-
20
-
21
-
22
-
23
-
24
-
25
-
26
-
27
-
28
-
29
-
30
-
31
-
32
-
33
-
34
-
35
-
36
-
37
-
38
-
39
-
40
-
41
-
 42
42 -
 43
43 -
 44
44 -
 45
45 -
 46
46 -
 47
47 -
 48
48 -
 49
49 -
 50
50 -
 51
51 -
 52
52 -
 53
53 -
 54
54 -
 55
55 -
 56
56 -
 57
57 -
 58
58 -
 59
59 -
 60
60 -
 61
61 -
 62
62 -
63
-
64
-
65
-
66
-
67
-
68
-
69
-
70
-
71
-
72
-
73
-
74
-
75
-
76
-
77
-
78
-
79
-
80
-
81
-
82
-
83
-
84
-
85
-
86
-
87
-
88
-
89
-
90
-
91
-
92
-
93
-
94
-
95
-
96
-
97
-
98
-
99
-
100
-
101
-
102
-
103
-
104
-
105
-
106
-
107
-
108
-
109
-
110
-
111
-
112
-
113
-
114
-
115
-
116
-
117
-
118
-
119
-
120
-
121
-
122
-
123
-
124
-
125
-
126
 |
 |
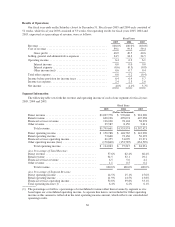
our improved performance, but also due to the elimination of extended vesting on executive bonus
compensation whereby deferred bonuses of $1.7 million were fully expensed in 2005 rather than
expensed over a two-year period in accordance with the previous plan. Depreciation expense increased
$2.8 million as the Wheeling distribution center was in service for a full year in 2005 compared to a
partial year in 2004. In addition, there were system related projects put in service for the distribution
centers tracking of inventory and for various corporate projects. Furniture and fixtures were put in
service for various corporate expansion projects. Supplies expense increased $2.0 million related to
increased supplies in the distribution area and additional new employees. Equipment and software items
that do not meet our capitalization policy and are charged to expense increased by $1.7 million due to
increased infrastructure and software maintenance costs. Property taxes increased by $1.7 million due to
a credit for an estimated rebate on a state tax program recorded in fiscal 2004.
•Direct selling, general and administrative expenses comprised $18.6 million of the total increase in
selling, general and administrative expense. Catalog production costs increased by $7.8 million, or
5.3%. Catalog costs increased to $154.2 million, or 14.9% of Direct revenue in fiscal 2005, from $146.4
million, or 15.1% of Direct revenue in fiscal 2004. This decrease in catalog costs as a percent of our
Direct revenue was primarily due to the strong Direct revenue increase and the focus on achieving the
optimal circulation program. Salary and related benefits increased by $5.0 million due in part to
additional employees in our promotional area and due to an increase in health insurance of $1.5 million.
The increase in health insurance was partly due to an increase in standard insurance rates charged to
some of our smaller subsidiaries as the number of their employees increased. Advertising increased by
$2.7 million as a result of Internet advertising fees. Our credit card discount fees increased by $1.9
million. As a percentage of revenue these fees increased 0.1% as interchange rates have increased.
Maintenance related equipment and software expenses increased by $0.6 million related to a software
and equipment maintenance agreement for our customer relations department.
•Retail selling, general and administrative expenses comprised $38.3 million of the total increase in selling,
general and administrative expense primarily due to having more stores and to increased new store
development and pre-opening costs. We break these costs into three categories. The first category is
pre-opening and new store development costs, which are all costs that we incur prior to a store’s opening.
The second category is the selling, general and administrative costs of new stores after they have opened,
but before they are included in the comparable store base. The final category is the selling, general and
administrative expenses that are incurred by the stores in our comparable store base. In fiscal 2005, our
new store development and pre-opening costs increased by $7.6 million related to our retail expansion
efforts. We also had four new stores that accounted for an increase of $34.5 million in selling, general and
administrative expenses. The increases in selling, general and administrative expenses related to new stores
were offset by a reduction of $3.7 million in the selling, general and administrative expenses of stores in
our comparable store base, compared to those same stores in the prior year.
•Financial Services selling, general and administrative expenses comprised $7.7 million of the total
increase in selling, general and administrative expense. Advertising and promotion costs increased by
$2.7 million due to increases in VISA assessments, new account acquisition costs and account retention
tools. Third-party data processing services increased by $1.8 million, as the number of credit card
accounts and transactions increased. Salary and related benefits increased $1.5 million with the growth
of the bank. Professional fees increased $0.9 million due to consulting services for industry data
research. Bad debt expense increased by $0.7 million primarily due to an increase in counterfeit fraud.
Our bad debts relating to fraud are less than industry standards. Total Financial Services selling, general
and administrative expenses as a percentage of Financial Services revenue decreased from 60.2% in
fiscal 2004 to 47.2% in fiscal 2005.
Operating Income
Operating income increased by $17.8 million, or 18.3%, to $115.0 million in fiscal 2005 from $97.2 million
in fiscal 2004 primarily due to the factors discussed above.
40