Cabela's 2005 Annual Report Download - page 53
Download and view the complete annual report
Please find page 53 of the 2005 Cabela's annual report below. You can navigate through the pages in the report by either clicking on the pages listed below, or by using the keyword search tool below to find specific information within the annual report.-
 1
1 -
2
-
3
-
4
-
5
-
6
-
7
-
8
-
9
-
10
-
11
-
12
-
13
-
14
-
15
-
16
-
17
-
18
-
19
-
20
-
21
-
22
-
23
-
24
-
25
-
26
-
27
-
28
-
29
-
30
-
31
-
32
-
33
-
34
-
35
-
36
-
37
-
38
-
39
-
40
-
41
-
42
-
 43
43 -
 44
44 -
 45
45 -
 46
46 -
 47
47 -
 48
48 -
 49
49 -
 50
50 -
 51
51 -
 52
52 -
 53
53 -
 54
54 -
 55
55 -
 56
56 -
 57
57 -
 58
58 -
 59
59 -
 60
60 -
 61
61 -
 62
62 -
 63
63 -
64
-
65
-
66
-
67
-
68
-
69
-
70
-
71
-
72
-
73
-
74
-
75
-
76
-
77
-
78
-
79
-
80
-
81
-
82
-
83
-
84
-
85
-
86
-
87
-
88
-
89
-
90
-
91
-
92
-
93
-
94
-
95
-
96
-
97
-
98
-
99
-
100
-
101
-
102
-
103
-
104
-
105
-
106
-
107
-
108
-
109
-
110
-
111
-
112
-
113
-
114
-
115
-
116
-
117
-
118
-
119
-
120
-
121
-
122
-
123
-
124
-
125
-
126
 |
 |
Other Income
Other income increased by $0.2 million to $10.6 million in fiscal 2005 from $10.4 million in fiscal 2004
primarily due to an increase in interest earned from economic development bonds of $3.5 million in fiscal 2005.
This increase was offset by decreases in gain on sale of investment and equity recognized for an unconsolidated
subsidiary of $3.3 million related to the sale of our investment in Great Wolf Lodge, LLC in fiscal 2004.
Interest Expense
Interest expense increased by $2.7 million in fiscal 2005 to $10.9 million as compared with $8.2 million in
fiscal 2004. The interest expense increase was primarily due to increased borrowings on our revolving line of
credit. In fiscal 2004, we were able to utilize the proceeds from our initial public offering rather than incurring
interest on our revolving line of credit.
Income Taxes
Our effective tax rate was 37.1% in fiscal 2005 compared to 35.1% in fiscal 2004. The increase in our
effective tax rate is a result of us entering additional states during 2005, changing our estimated rate on deferred
taxes and truing up our prior year’s tax provision. We expect that our effective tax rate will continue to increase
as we enter more states with our destination retail stores.
Fiscal Year 2004 Compared to Fiscal Year 2003
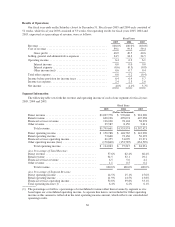
Revenue
Revenue increased by $163.6 million, or 11.7%, to $1,556.0 million in fiscal 2004 from $1,392.4 million in
fiscal 2003 as we experienced revenue growth in each of our segments. We had 53 weeks in fiscal 2003 versus
52 weeks in fiscal 2004. On a comparative 52 week basis, revenue increased by 13.4%.
Direct Revenue. Direct revenue increased by $46.3 million, or 5.0%, to $970.6 million in fiscal 2004 from
$924.3 million in fiscal 2003 primarily due to growth in sales through our website. When we adjust for the extra
week in fiscal 2003, our direct revenue grew by 6.6%. The number of customer packages shipped increased by
5.3% to 8.1 million in fiscal 2004. Circulation of our catalogs increased by 3.3 billion pages, or 10.6%, to 34.5
billion pages in fiscal 2004 from 31.2 billion pages in fiscal 2003. The number of active customers, which we
define as those customers who have purchased merchandise from us in the last twelve months, increased by 6.1%
to approximately 4.2 million in fiscal 2004 over fiscal 2003. The product categories that contributed the largest
dollar volume increase to our Direct revenue growth included work wear, home furnishings and archery with
paint ball being our fastest growing category in the Direct segment for fiscal 2004.
Retail Revenue. Retail revenue increased by $91.8 million, or 22.5%, to $499.1 million in fiscal 2004 from
$407.2 million in fiscal 2003 due to increased new store sales of $99.8 million. Retail revenue increased 24.4%
on a comparative 52 week basis. Revenue for stores in our comparable base decreased by $8.0 million compared
to fiscal 2003. We believe that the decrease is primarily attributable to the extra week in fiscal 2003. Our
comparable store sales on a 52 week basis decreased 0.6%. The product categories that contributed the largest
dollar volume increase to our Retail revenue growth included firearms, archery, and optics with paint ball being
our fastest growing category in the Retail segment for fiscal 2004.
Financial Services Revenue. Financial Services revenue increased by $19.8 million, or 34.0%, to $78.1
million in fiscal 2004 from $58.3 million in fiscal 2003, due to an increase in securitization income of $22.0
million, an increase in other non-interest income of $5.9 million and an increase in net interest and fee income of
$5.0 million. The 29.5% increase in securitization income was primarily a result of interchange income
increasing by $20.6 million as our customers’ VISA net purchases increased by 26.9%. In addition, an increase in
VISA rates improved interchange income by $1.4 million for the fiscal year. The increase in securitization
41