Cabela's 2005 Annual Report Download - page 41
Download and view the complete annual report
Please find page 41 of the 2005 Cabela's annual report below. You can navigate through the pages in the report by either clicking on the pages listed below, or by using the keyword search tool below to find specific information within the annual report.-
 1
1 -
2
-
3
-
4
-
5
-
6
-
7
-
8
-
9
-
10
-
11
-
12
-
13
-
14
-
15
-
16
-
17
-
18
-
19
-
20
-
21
-
22
-
23
-
24
-
25
-
26
-
27
-
28
-
29
-
30
-
 31
31 -
 32
32 -
 33
33 -
 34
34 -
 35
35 -
 36
36 -
 37
37 -
 38
38 -
 39
39 -
 40
40 -
 41
41 -
 42
42 -
 43
43 -
 44
44 -
 45
45 -
 46
46 -
 47
47 -
 48
48 -
 49
49 -
 50
50 -
 51
51 -
52
-
53
-
54
-
55
-
56
-
57
-
58
-
59
-
60
-
61
-
62
-
63
-
64
-
65
-
66
-
67
-
68
-
69
-
70
-
71
-
72
-
73
-
74
-
75
-
76
-
77
-
78
-
79
-
80
-
81
-
82
-
83
-
84
-
85
-
86
-
87
-
88
-
89
-
90
-
91
-
92
-
93
-
94
-
95
-
96
-
97
-
98
-
99
-
100
-
101
-
102
-
103
-
104
-
105
-
106
-
107
-
108
-
109
-
110
-
111
-
112
-
113
-
114
-
115
-
116
-
117
-
118
-
119
-
120
-
121
-
122
-
123
-
124
-
125
-
126
 |
 |

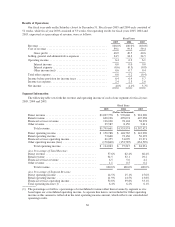
ITEM 6. SELECTED FINANCIAL DATA
You should read the selected historical consolidated financial and other data set forth below in conjunction
with “Management’s Discussion and Analysis of Financial Condition and Results of Operations” and our audited
consolidated financial statements and the related notes included elsewhere in this report. In the opinion of
management, the audited consolidated financial statements reflect all adjustments which are necessary to
summarize fairly our financial position and our results of operations and cash flows for the periods presented. We
have derived the historical consolidated statement of operations data for our fiscal years 2005, 2004 and 2003
and the historical consolidated balance sheet data as of the end of our fiscal years 2005 and 2004 from our
audited consolidated financial statements included elsewhere in this report. We have derived the historical
consolidated statement of operations data for our fiscal year 2002 and 2001 and the historical consolidated
balance sheet data as of the end of our fiscal years 2003, 2002 and 2001 from our audited historical consolidated
financial statements that are not included in this report. The historical results presented below are not necessarily
indicative of the results to be expected for any future period.
Fiscal Year (1)
2005 2004 2003 2002 2001
(Dollars in thousands, except per share data)
Statement of Operations Data:
Revenue:
Direct revenue ........................................ $1,037,778 $ 970,646 $ 924,296 $ 867,799 $ 787,170
Retail revenue ........................................ 620,196 499,074 407,238 305,791 262,330
Financial services revenue (2) ............................ 116,100 78,104 58,278 46,387 27,329
Other revenue (3) ...................................... 25,587 8,150 2,611 4,604 770
Total revenue ..................................... 1,799,661 1,555,974 1,392,423 1,224,581 1,077,599
Cost of revenue ........................................... 1,064,322 925,665 827,528 735,445 662,186
Gross profit .............................................. 735,339 630,309 564,895 489,136 415,413
Selling, general and administrative expenses .................... 620,376 533,094 479,964 413,135 353,462
Operating income .......................................... 114,963 97,215 84,931 76,001 61,951
Interest income ........................................ 672 601 408 443 404
Interest expense ....................................... (10,928) (8,178) (11,158) (8,413) (7,307)
Other income (4) ...................................... 10,663 10,443 5,612 4,708 4,387
Income before provision for income taxes ....................... 115,370 100,081 79,793 72,739 59,435
Provision for income taxes ................................... 42,801 35,085 28,402 25,817 21,020
Net income ............................................... 72,569 64,996 51,391 46,922 38,415
Less:Cumulativeredeemableconvertiblepreferredstockdividend(6)..————(3,901)
Income available to common stockholders ...................... $ 72,569 $ 64,996 $ 51,391 $ 46,922 $ 34,514
Basic earnings per share ..................................... $ 1.12 $ 1.06 $ 0.99 $ 0.94 $ 0.77
Diluted earnings per share ................................... $ 1.10 $ 1.03 $ 0.93 $ 0.88 $ 0.71
Weighted average basic shares outstanding (000’s) ............... 64,669 61,277 52,060 49,899 44,920
Weighted average diluted shares outstanding (000’s) .............. 66,268 63,277 55,307 53,400 53,742
Selected Balance Sheet Data (as of end of period):
Cash and cash equivalents(5) ................................. $ 86,923 $ 248,184 $ 192,581 $ 178,636 $ 109,755
Working capital ........................................... 145,559 274,746 228,580 188,229 100,082
Total assets ............................................... 1,366,280 1,228,231 963,553 834,968 646,690
Total debt ................................................ 119,826 148,152 142,651 161,452 62,545
Total stockholders’ equity ................................... 639,853 566,354 372,515 259,530 212,075
Selected Cash Flow Data (7)
Net cash flows from operating activities ........................ $ 72,564 $ 46,659 $ 63,253 $ 54,797 $ 69,946
Net cash flows from investing activities ........................ (204,867) (126,811) (89,735) (83,615) (72,251)
Net cash flows from financing activities ........................ (28,958) 135,755 40,427 97,699 84,336
Other Data:
Number of catalogs mailed (000’s) ............................ 121,606 120,383 103,976 96,723 83,520
Number of destination retail stores (at end of period) .............. 14 10987
Total gross square footage (at end of the period) .................. 2,097,840 1,317,060 1,140,709 893,810 707,868
Average sales per gross square foot (8) ......................... $ 367 $ 398 $ 386 $ 381 $ 367
Comparable store sales growth (9) ............................. (6.3)% (0.6)% 0.2% 3.7% 3.8%
Depreciation and amortization ................................ $ 34,912 $ 29,843 $ 26,715 $ 23,539 $ 17,355
Capital expenditures ........................................ 194,659 52,568 72,972 53,387 47,257
Purchases of marketable securities (10) ......................... 65,077 74,492 18,201 32,821 13,768
EBITDA (11) ............................................. $ 160,538 $ 137,501 $ 117,258 $ 104,248 $ 83,693
EBITDA margin (12) ....................................... 8.9% 8.8% 8.4% 8.5% 7.8%
29