Cabela's 2005 Annual Report Download - page 42
Download and view the complete annual report
Please find page 42 of the 2005 Cabela's annual report below. You can navigate through the pages in the report by either clicking on the pages listed below, or by using the keyword search tool below to find specific information within the annual report.-
 1
1 -
2
-
3
-
4
-
5
-
6
-
7
-
8
-
9
-
10
-
11
-
12
-
13
-
14
-
15
-
16
-
17
-
18
-
19
-
20
-
21
-
22
-
23
-
24
-
25
-
26
-
27
-
28
-
29
-
30
-
31
-
 32
32 -
 33
33 -
 34
34 -
 35
35 -
 36
36 -
 37
37 -
 38
38 -
 39
39 -
 40
40 -
 41
41 -
 42
42 -
 43
43 -
 44
44 -
 45
45 -
 46
46 -
 47
47 -
 48
48 -
 49
49 -
 50
50 -
 51
51 -
 52
52 -
53
-
54
-
55
-
56
-
57
-
58
-
59
-
60
-
61
-
62
-
63
-
64
-
65
-
66
-
67
-
68
-
69
-
70
-
71
-
72
-
73
-
74
-
75
-
76
-
77
-
78
-
79
-
80
-
81
-
82
-
83
-
84
-
85
-
86
-
87
-
88
-
89
-
90
-
91
-
92
-
93
-
94
-
95
-
96
-
97
-
98
-
99
-
100
-
101
-
102
-
103
-
104
-
105
-
106
-
107
-
108
-
109
-
110
-
111
-
112
-
113
-
114
-
115
-
116
-
117
-
118
-
119
-
120
-
121
-
122
-
123
-
124
-
125
-
126
 |
 |

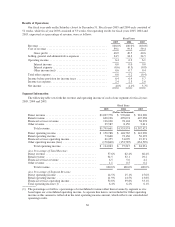
(1) Our fiscal years are based on the 52-53 week period ending on the Saturday closest to December 31. Our fiscal years 2005, 2004, 2002,
and 2001 consisted of 52 weeks and our fiscal year 2003 consisted of 53 weeks.
(2) On March 23, 2001, we purchased the remaining 50% ownership interest in Cabela’s Card, LLC that we did not previously own and
formed a new wholly-owned bank subsidiary, World’s Foremost Bank. The financial results of the bank were consolidated with our
results beginning March 23, 2001.
(3) Other revenue consists primarily of revenue from our real estate and travel businesses.
(4) Other income primarily consists of interest earned on economic development bonds, gains on sales of marketable securities and equity in
undistributed net earnings (losses) of equity method investees.
(5) At fiscal year end 2005, 2004, 2003, 2002 and 2001, cash and cash equivalents at World’s Foremost Bank were $80.6 million, $58.1
million, $77.2 million, $35.0 million and $34.4 million, respectively, which is included in our consolidated cash and cash equivalents.
Due to regulatory restrictions, our ability to use this cash for non-banking operations, including for working capital for our direct or retail
businesses or for destination retail store expansion, may be limited. See “Management’s Discussion and Analysis of Financial Condition
and Results of Operation—Bank Dividend Limitations and Minimum Capital Requirements.”
(6) In September 2001, all outstanding shares of cumulative redeemable convertible preferred stock were converted to non-voting common
stock.
(7) Cash flow data is shown as reclassified. In fiscal 2005, the Company reclassified certain portions of its retained interests related to its
financial services business to operating cash flows from investing cash flows. All periods presented are shown as reclassified. We believe
this reclassification does not have a material impact on our financial statements.
(8) Average sales per gross square foot includes sales and square footage of stores that are open at the beginning of the period and at the end
of the period.
(9) A store is included in our comparable store sales base the first day of the month following the fifteen month anniversary of its opening or
expansion by greater than 25% of total square footage. The percentages shown are based on a 52 to 52 week comparison.
(10) This amount consists primarily of purchases of economic development bonds, the proceeds of which are used to construct our destination
retail stores and related infrastructure. See “Management’s Discussion and Analysis of Financial Condition and Results of Operations—
Liquidity and Capital Resources—Retail Store Expansion.”
(11) When we use the term “EBITDA”, we are referring to net income minus interest income plus interest expense, income taxes and
depreciation and amortization. We present EBITDA because we consider it an important supplemental measure of our performance. We
also use EBITDA to determine our compliance with some of the covenants under our revolving credit facility.
EBITDA has limitations as an analytical tool and you should not consider it in isolation or as a substitute for net income, operating income,
cash flows from operating, investing or financing activities or any other measure calculated in accordance with generally accepted
accounting principles. Some of these limitations are:
• EBITDA does not reflect our cash expenditures or future requirements for capital expenditures or capital commitments;
• EBITDA does not reflect changes in, or cash requirements for, our working capital needs;
• EBITDA does not reflect the interest expense or cash requirements necessary to service interest or principal payments on our
debt;
• Although depreciation and amortization are non-cash charges, the assets being depreciated and amortized will often have to
be replaced in the future, and EBITDA does not reflect any cash requirements for such replacements; and
• Other companies in our industry may calculate EBITDA differently than we do, limiting its usefulness as a comparative
measure.
Because of these limitations, EBITDA should not be considered as a measure of discretionary cash available to us to invest in the growth
of our business and we rely primarily on our GAAP results and use EBITDA only supplementally.
The following table reconciles EBITDA to net income:
Fiscal Year (1)
2005 2004 2003 2002 2001
(Dollars in thousands)
Net income ....................................................... $ 72,569 $ 64,996 $ 51,391 $ 46,922 $38,415
Deprecation and amortization. .................................... 34,912 29,843 26,715 23,539 17,355
Interest income ................................................ (672) (601) (408) (443) (404)
Interest expense ................................................ 10,928 8,178 11,158 8,413 7,307
Income taxes .................................................. 42,801 35,085 28,402 25,817 21,020
EBITDA ......................................................... $160,538 $137,501 $117,258 $104,248 $83,693
(12) EBITDA margin is defined as our consolidated EBITDA as a percentage of our consolidated revenue.
30