Cabela's 2005 Annual Report Download - page 55
Download and view the complete annual report
Please find page 55 of the 2005 Cabela's annual report below. You can navigate through the pages in the report by either clicking on the pages listed below, or by using the keyword search tool below to find specific information within the annual report.-
 1
1 -
2
-
3
-
4
-
5
-
6
-
7
-
8
-
9
-
10
-
11
-
12
-
13
-
14
-
15
-
16
-
17
-
18
-
19
-
20
-
21
-
22
-
23
-
24
-
25
-
26
-
27
-
28
-
29
-
30
-
31
-
32
-
33
-
34
-
35
-
36
-
37
-
38
-
39
-
40
-
41
-
42
-
43
-
44
-
 45
45 -
 46
46 -
 47
47 -
 48
48 -
 49
49 -
 50
50 -
 51
51 -
 52
52 -
 53
53 -
 54
54 -
 55
55 -
 56
56 -
 57
57 -
 58
58 -
 59
59 -
 60
60 -
 61
61 -
 62
62 -
 63
63 -
 64
64 -
 65
65 -
66
-
67
-
68
-
69
-
70
-
71
-
72
-
73
-
74
-
75
-
76
-
77
-
78
-
79
-
80
-
81
-
82
-
83
-
84
-
85
-
86
-
87
-
88
-
89
-
90
-
91
-
92
-
93
-
94
-
95
-
96
-
97
-
98
-
99
-
100
-
101
-
102
-
103
-
104
-
105
-
106
-
107
-
108
-
109
-
110
-
111
-
112
-
113
-
114
-
115
-
116
-
117
-
118
-
119
-
120
-
121
-
122
-
123
-
124
-
125
-
126
 |
 |
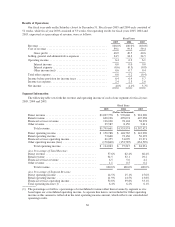
•Retail selling, general and administrative expenses comprised $15.2 million of the total increase in
selling, general and administrative expense primarily due to new store operating costs of $16.4 million,
which were offset by a reduction in comparable store costs of $1.2 million. Included in the new store
costs were our pre-opening and expansion costs, which decreased by $3.4 million over fiscal 2003. In
2004, we opened a 176,000 square foot store as compared to 2003 when we opened a 247,000 square
foot store. The size of the store impacted the pre-opening costs. The pre-opening costs include vendor
cooperative payments and direct reimbursement advertising that reduced the pre-opening costs of our
stores. Included in the comparable store costs was a reduction in salary and wages of $2.1 million due to
better payroll management and scheduling practices. Total advertising remained flat as a percent of
revenue for the year at 1.8% of revenue. Total salary and wages, including new stores, decreased as a
percent of retail revenue by 0.8% to 11.2% in fiscal 2004, from 12.0% in fiscal 2003.
• Financial Services selling, general and administrative expenses comprised $8.0 million of the total
increase in selling, general and administrative expense. Third-party data processing services increased
by $2.3 million, as the number of credit card transactions increased. Salary and wages along with bonus
and other related wage costs increased $2.2 million with the growth of the bank. Advertising and
promotion costs related to new account acquisitions increased by $1.7 million and bad debt expense
increased by $0.9 million as the amount of managed receivables outstanding increased. As a percentage
of managed receivables our bad debt expense decreased and continued to be well below industry
standards. Postage increased by $0.8 million, but as a percentage of revenue it decreased.
Operating Income
Operating income increased by $12.3 million, or 14.5%, to $97.2 million in fiscal 2004 from $84.9 million
in fiscal 2003 primarily due to the factors discussed above.
Other Income
Other income increased by $4.8 million, to $10.4 million in fiscal 2004 from $5.6 million in fiscal 2003
primarily due to an increase in interest earned from economic development bonds of $2.5 million and due to a
gain on the sale of our investment in Great Wolf Lodge, LLC.
Interest Expense
Interest expense decreased by $3.0 million in fiscal 2004 to $8.2 million as compared with $11.2 million in
fiscal 2003. The interest expense decrease was primarily due to changes made to our deferred compensation plan
in 2003, which reduced interest by $2.4 million, a reduction in long-term and short-term borrowings and the
discontinuance of our employee savings plan in December of 2003.
Income Taxes
Our effective tax rate was 35.1% in fiscal 2004 as compared to 35.6% in fiscal 2003. This decline in the
effective rate was due to prior year tax audits that were settled in our favor. We expect our effective rate to
increase in fiscal 2005 as we enter more states with our destination retail stores.
43