Cabela's 2005 Annual Report Download - page 86
Download and view the complete annual report
Please find page 86 of the 2005 Cabela's annual report below. You can navigate through the pages in the report by either clicking on the pages listed below, or by using the keyword search tool below to find specific information within the annual report.-
 1
1 -
2
-
3
-
4
-
5
-
6
-
7
-
8
-
9
-
10
-
11
-
12
-
13
-
14
-
15
-
16
-
17
-
18
-
19
-
20
-
21
-
22
-
23
-
24
-
25
-
26
-
27
-
28
-
29
-
30
-
31
-
32
-
33
-
34
-
35
-
36
-
37
-
38
-
39
-
40
-
41
-
42
-
43
-
44
-
45
-
46
-
47
-
48
-
49
-
50
-
51
-
52
-
53
-
54
-
55
-
56
-
57
-
58
-
59
-
60
-
61
-
62
-
63
-
64
-
65
-
66
-
67
-
68
-
69
-
70
-
71
-
72
-
73
-
74
-
75
-
 76
76 -
 77
77 -
 78
78 -
 79
79 -
 80
80 -
 81
81 -
 82
82 -
 83
83 -
 84
84 -
 85
85 -
 86
86 -
 87
87 -
 88
88 -
 89
89 -
 90
90 -
 91
91 -
 92
92 -
 93
93 -
 94
94 -
 95
95 -
 96
96 -
97
-
98
-
99
-
100
-
101
-
102
-
103
-
104
-
105
-
106
-
107
-
108
-
109
-
110
-
111
-
112
-
113
-
114
-
115
-
116
-
117
-
118
-
119
-
120
-
121
-
122
-
123
-
124
-
125
-
126
 |
 |

CABELA’S INCORPORATED AND SUBSIDIARIES
NOTES TO CONSOLIDATED FINANCIAL STATEMENTS—(Continued)
(Dollar Amounts in Thousands Except Share and Per Share Amounts)
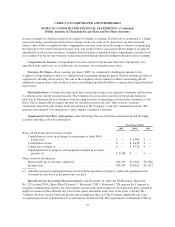
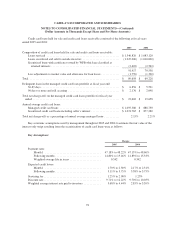
For purposes of pro forma disclosures, the estimated fair value of the options granted is amortized to
expense over the options’ vesting period. The Company’s pro forma net income for 2005, 2004 and 2003 was as
follows:
2005 2004 2003
Net income—as reported .......................................... $72,569 $64,996 $51,391
Add: Stock based employee compensation recognized, net of tax .......... 600 1,086 —
Deduct: Total stock-based employee compensation expense determined under
fair value based method for all awards, net of related tax effects ......... (6,811) (4,759) (953)
Net income—pro forma ........................................... $66,358 $61,323 $50,438
Earnings per share:
Basic—as reported ........................................... $ 1.12 $ 1.06 $ 0.99
Basic—proforma ............................................ $ 1.03 $ 1.00 $ 0.97
Diluted—as reported ......................................... $ 1.10 $ 1.03 $ 0.93
Diluted—proforma ........................................... $ 0.97 $ 0.94 $ 0.92
The fair value of options granted on and subsequent to May 1, 2004 was estimated on the date of the grant
using the Black-Scholes option pricing model with the following weighted-average assumptions: the expected
stock price volatility was 50%; the risk free interest at grant date ranged from 3.57% to 4.38% and the expected
term was 4.5 years. Prior to the May 1, 2004 option grants, the Company used a binomial model and did not
include a volatility factor. On April 14, 2005, the Company granted 678,000 options to employees that vested
immediately.
Financial Instruments and Credit Risk Concentrations—Financial instruments, which potentially subject
the Company to concentrations of credit risk, are primarily cash, investments and accounts receivable. The
Company places its investments primarily in tax-free municipal bonds or commercial paper with short-term
maturities, and limits the amount of credit exposure to any one entity. Concentrations of credit risk with respect
to accounts receivable are limited due to the nature of the Company’s receivables.
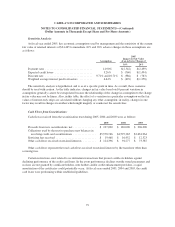
Fair Value of Financial Instruments—The carrying amount of cash and cash equivalents, receivables,
credit card loans held for sale, retained interests in asset securitizations, accounts payable, notes payable to banks
and accrued expenses approximate fair value because of the short maturity of these instruments. The fair values
of each of the Company’s long-term debt instruments are based on the amount of future cash flows associated
with each instrument discounted using the Company’s current borrowing rate for similar debt instruments of
comparable maturity. The fair value estimates are made at a specific point in time and the underlying
assumptions are subject to change based on market conditions. At fiscal year ended 2005 and 2004, the carrying
amount of the Company’s long-term debt was $119,826 and $148,152, respectively, with an estimated fair value
of approximately $120,125 and $150,910, respectively. For purposes of estimating fair value, time deposits are
pooled in homogeneous groups and the future cash flows of those groups are discounted using current market
rates offered for similar products. At fiscal year end 2005 and 2004, the carrying amounts of the Company’s time
deposits were $109,488 and $100,659, respectively, with an estimated fair value of approximately $113,632 and
$100,636, respectively.
Derivatives—The Company uses derivatives for the purpose of hedging exposure to changes in interest rates
and foreign currency exchange rates. The fair value of each derivative is recognized in the balance sheet within
current assets or current liabilities. Changes in the fair value of derivatives are recognized immediately in the
74