Cabela's 2005 Annual Report Download - page 56
Download and view the complete annual report
Please find page 56 of the 2005 Cabela's annual report below. You can navigate through the pages in the report by either clicking on the pages listed below, or by using the keyword search tool below to find specific information within the annual report.-
 1
1 -
2
-
3
-
4
-
5
-
6
-
7
-
8
-
9
-
10
-
11
-
12
-
13
-
14
-
15
-
16
-
17
-
18
-
19
-
20
-
21
-
22
-
23
-
24
-
25
-
26
-
27
-
28
-
29
-
30
-
31
-
32
-
33
-
34
-
35
-
36
-
37
-
38
-
39
-
40
-
41
-
42
-
43
-
44
-
45
-
 46
46 -
 47
47 -
 48
48 -
 49
49 -
 50
50 -
 51
51 -
 52
52 -
 53
53 -
 54
54 -
 55
55 -
 56
56 -
 57
57 -
 58
58 -
 59
59 -
 60
60 -
 61
61 -
 62
62 -
 63
63 -
 64
64 -
 65
65 -
 66
66 -
67
-
68
-
69
-
70
-
71
-
72
-
73
-
74
-
75
-
76
-
77
-
78
-
79
-
80
-
81
-
82
-
83
-
84
-
85
-
86
-
87
-
88
-
89
-
90
-
91
-
92
-
93
-
94
-
95
-
96
-
97
-
98
-
99
-
100
-
101
-
102
-
103
-
104
-
105
-
106
-
107
-
108
-
109
-
110
-
111
-
112
-
113
-
114
-
115
-
116
-
117
-
118
-
119
-
120
-
121
-
122
-
123
-
124
-
125
-
126
 |
 |

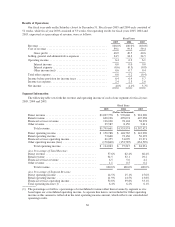
Quarterly Results of Operations and Seasonal Influences
Due to holiday buying patterns and hunting and fishing season openings across the country, merchandise
revenue is typically higher in the third and fourth quarters than in the first and second quarters. We anticipate our
revenue will continue to be seasonal in nature.
The following table sets forth unaudited financial and operating data in each quarter during fiscal years 2005
and 2004. This quarterly information has been prepared on a basis consistent with our audited financial
statements and includes all normal recurring adjustments that we consider necessary for a fair presentation of the
information shown. This information should be read in conjunction with our selected financial data and audited
consolidated financial statements and the notes thereto appearing elsewhere in this report. Our quarterly
operating results may fluctuate significantly as a result of these and a variety of other factors, and operating
results for any quarter are not necessarily indicative of results for a full fiscal year. See “Risk Factors” and
“—Influences on Period Comparability.”
Unaudited
2005 2004
First
Quarter
Second
Quarter
Third
Quarter
Fourth
Quarter
First
Quarter
Second
Quarter (1)
Third
Quarter
Fourth
Quarter
(Dollars in thousands except EPS)
Net revenue ..................... $350,589 $343,872 $429,753 $675,447 $313,917 $279,139 $383,810 $579,108
Gross profit ...................... 137,228 135,160 174,759 288,192 125,242 106,853 156,421 241,793
Operating income ................. 11,023 8,822 26,260 68,858 12,703 3,232 25,495 55,785
Net income ...................... 7,767 6,016 16,275 42,511 8,046 1,987 16,503 38,460
Earnings per share—basic (2) ....... $ 0.12 $ 0.09 $ 0.25 $ 0.66 $ 0.14 $ 0.03 $ 0.26 $ 0.60
Earnings per share—diluted (2) ...... $ 0.12 $ 0.09 $ 0.25 $ 0.64 $ 0.14 $ 0.03 $ 0.25 $ 0.58
As a percentage of full year results:
Revenue ........................ 19.5% 19.1% 23.9% 37.5% 20.2% 17.9% 24.7% 37.2%
Gross profit ...................... 18.7% 18.3% 23.8% 39.2% 19.9% 17.0% 24.8% 38.3%
Operating income ................. 9.6% 7.7% 22.8% 59.9% 13.1% 3.3% 26.2% 57.4%
Net income ...................... 10.7% 8.3% 22.4% 58.6% 12.4% 3.1% 25.4% 59.1%
(1) We recognized an offset to revenue in the second fiscal quarter of fiscal 2004 of $3.1 million as a result of the completion of a
securitization transaction in our Financial Services segment in that quarter.
(2) Basic and diluted earnings per share are computed independently for each of the quarters presented. Due to our initial public offering in
2004, the sum of the fiscal 2004 quarterly earnings per share may not total the amounts for fiscal 2004.
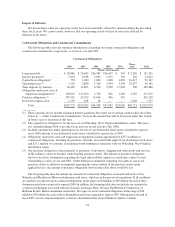
Bank Asset Quality
We securitize a majority of our credit card loans. On a quarterly basis, we transfer eligible credit card loans
into a securitization trust. We are required to own at least a minimum twenty day average of 5% of the interests
in the securitization trust. Therefore, these retained loans have the same characteristics as those loans sold to
outside investors. Certain accounts are ineligible for securitization because they are delinquent at the time of
sales to the trust, originated from sources other than Cabela’s Club credit cards and various other requirements.
The total amount of ineligible loans and receivables were $14.1 million and $6.1 million at fiscal year end 2005
and fiscal year end 2004, respectively. Of the $14.1 million outstanding at fiscal year end 2005, $12.6 million
originated from sources other than Cabela’s Club credit cards. The following table shows credit card loans
available for sale along with those securitized as of fiscal year end 2005, 2004 and 2003:
2005 2004 2003
Loans
Outstanding
>90 Days
Delinquent
Loans
Outstanding
>90 Days
Delinquent
Loans
Outstanding
>90 Days
Delinquent
Loans held for sale (median FICO score of 775 in 2005
and 776 in 2004) .............................. $ 8,606 — $ 4,202 — $ 4,223 —
Loans securitized and transferor’s interest (median FICO
score of 778 in 2005; and 774 in 2004) ............. 1,318,140 $1,752 1,072,910 $1,808 867,982 $1,433
Total .......................................... $1,326,746 $1,752 $1,077,112 $1,808 $872,205 $1,433
44