Cabela's 2005 Annual Report Download - page 57
Download and view the complete annual report
Please find page 57 of the 2005 Cabela's annual report below. You can navigate through the pages in the report by either clicking on the pages listed below, or by using the keyword search tool below to find specific information within the annual report.-
 1
1 -
2
-
3
-
4
-
5
-
6
-
7
-
8
-
9
-
10
-
11
-
12
-
13
-
14
-
15
-
16
-
17
-
18
-
19
-
20
-
21
-
22
-
23
-
24
-
25
-
26
-
27
-
28
-
29
-
30
-
31
-
32
-
33
-
34
-
35
-
36
-
37
-
38
-
39
-
40
-
41
-
42
-
43
-
44
-
45
-
46
-
 47
47 -
 48
48 -
 49
49 -
 50
50 -
 51
51 -
 52
52 -
 53
53 -
 54
54 -
 55
55 -
 56
56 -
 57
57 -
 58
58 -
 59
59 -
 60
60 -
 61
61 -
 62
62 -
 63
63 -
 64
64 -
 65
65 -
 66
66 -
 67
67 -
68
-
69
-
70
-
71
-
72
-
73
-
74
-
75
-
76
-
77
-
78
-
79
-
80
-
81
-
82
-
83
-
84
-
85
-
86
-
87
-
88
-
89
-
90
-
91
-
92
-
93
-
94
-
95
-
96
-
97
-
98
-
99
-
100
-
101
-
102
-
103
-
104
-
105
-
106
-
107
-
108
-
109
-
110
-
111
-
112
-
113
-
114
-
115
-
116
-
117
-
118
-
119
-
120
-
121
-
122
-
123
-
124
-
125
-
126
 |
 |

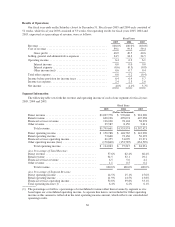
As reflected in the preceding table, the credit quality of our reported credit card loans does not have a
significant effect on the overall quality of our entire managed portfolio. As a result, we generally only monitor
the asset quality of the managed portfolio.
The quality of our managed credit card loan portfolio at any time reflects, among other factors, the
creditworthiness of the individual cardholders, general economic conditions, the success of our account
management and collection activities, and the life cycle stage of the portfolio. Our financial results are sensitive
to changes in delinquencies and net charge-offs of this portfolio. During periods of economic weakness,
delinquencies and net charge-offs are more likely to increase. We have sought to manage this sensitivity by
selecting a customer base that has historically shown itself to be very creditworthy based on charge-off levels,
credit bureau scores such as Fair Isaac & Company (“FICO”) scores and behavior scores.
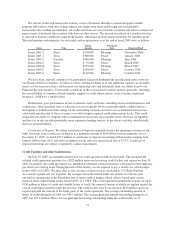
Our average managed credit card loans outstanding increased by $207 million, or 23.3%, to $1,096 million
in fiscal 2005 from $889 million in fiscal 2004. We believe that as credit card accounts mature they are less
likely to charge-off and less likely to be closed. The following table shows our managed loans outstanding at
fiscal year end 2005 and 2004 by months since the account opened.
2005 2004
Loans
Outstanding
Percentage of
Total
Loans
Outstanding
Percentage of
Total
(Dollars in thousands)
Months Since Account Opened
6 months or Less ................................ $ 87,394 6.5% $ 53,803 5.0%
7 – 12 months .................................. 83,531 6.2 70,600 6.5
13 – 24 months .................................. 170,864 12.7 155,500 14.4
25 – 36 months .................................. 170,886 12.8 169,804 15.7
37 – 48 months .................................. 178,980 13.3 183,254 16.9
49 – 60 months .................................. 190,011 14.2 233,624 21.5
61 – 72 months .................................. 240,743 18.0 82,640 7.6
73 – 84 months .................................. 83,701 6.3 28,514 2.6
85 + months .................................... 134,710 10.0 105,381 9.8
Total ...................................... $1,340,820 100.0% $1,083,120 100.0%
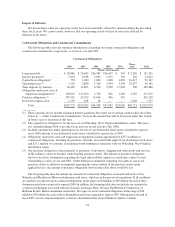
Delinquencies
We consider the entire balance of an account, including any accrued interest and fees, delinquent if the
minimum payment is not received by the payment due date. Our aging methodology is based on the number of
completed billing cycles during which a customer has failed to make a required payment. Delinquencies not only
have the potential to reduce earnings by increasing the unrealized loss recognized to reduce the loans to market
value and reducing securitization income, but they also result in additional operating costs dedicated to resolving
the delinquencies. The following chart shows the percentage of our managed loans that have been delinquent as
of the end of fiscal years 2005, 2004 and 2003.
Fiscal Year
2005 2004 2003
Number of days delinquent
Greater than 30 days ................................. 0.67% 0.71% 0.80%
Greater than 60 days ................................. 0.38% 0.41% 0.43%
Greater than 90 days ................................. 0.16% 0.19% 0.18%
45