Cabela's 2005 Annual Report Download - page 48
Download and view the complete annual report
Please find page 48 of the 2005 Cabela's annual report below. You can navigate through the pages in the report by either clicking on the pages listed below, or by using the keyword search tool below to find specific information within the annual report.-
 1
1 -
2
-
3
-
4
-
5
-
6
-
7
-
8
-
9
-
10
-
11
-
12
-
13
-
14
-
15
-
16
-
17
-
18
-
19
-
20
-
21
-
22
-
23
-
24
-
25
-
26
-
27
-
28
-
29
-
30
-
31
-
32
-
33
-
34
-
35
-
36
-
37
-
 38
38 -
 39
39 -
 40
40 -
 41
41 -
 42
42 -
 43
43 -
 44
44 -
 45
45 -
 46
46 -
 47
47 -
 48
48 -
 49
49 -
 50
50 -
 51
51 -
 52
52 -
 53
53 -
 54
54 -
 55
55 -
 56
56 -
 57
57 -
 58
58 -
59
-
60
-
61
-
62
-
63
-
64
-
65
-
66
-
67
-
68
-
69
-
70
-
71
-
72
-
73
-
74
-
75
-
76
-
77
-
78
-
79
-
80
-
81
-
82
-
83
-
84
-
85
-
86
-
87
-
88
-
89
-
90
-
91
-
92
-
93
-
94
-
95
-
96
-
97
-
98
-
99
-
100
-
101
-
102
-
103
-
104
-
105
-
106
-
107
-
108
-
109
-
110
-
111
-
112
-
113
-
114
-
115
-
116
-
117
-
118
-
119
-
120
-
121
-
122
-
123
-
124
-
125
-
126
 |
 |

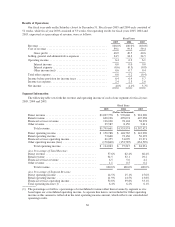
Results of Operations
Our fiscal year ends on the Saturday closest to December 31. Fiscal years 2005 and 2004 each consisted of
52 weeks, while fiscal year 2003 consisted of 53 weeks. Our operating results for fiscal years 2005, 2004 and
2003, expressed as a percentage of revenue, were as follows:
Fiscal Years
2005 2004 2003
Revenue ................................................ 100.0% 100.0% 100.0%
Cost of revenue .......................................... 59.1 59.5 59.4
Gross profit ......................................... 40.9 40.5 40.6
Selling, general and administrative expenses ................... 34.5 34.3 34.5
Operating income ........................................ 6.4 6.2 6.1
Interest income ...................................... 0.0 0.0 0.0
Interest expense ...................................... (0.6) (0.5) (0.8)
Other income (net) ................................... 0.6 0.7 0.4
Total other expense ....................................... 0.0 0.2 (0.4)
Income before provision for income taxes ..................... 6.4 6.4 5.7
Income tax expense ....................................... 2.4 2.3 2.0
Net income ............................................. 4.0% 4.1% 3.7%
Segment Information
The following table sets forth the revenue and operating income of each of our segments for fiscal years
2005, 2004 and 2003.
Fiscal Years
2005 2004 2003
(Dollars in thousands)
Direct revenue ................................... $1,037,778 $ 970,646 $ 924,296
Retail revenue ................................... 620,196 499,074 407,238
Financial services revenue ......................... 116,100 78,104 58,278
Other revenue ................................... 25,587 8,150 2,611
Total revenue ................................ $1,799,661 $1,555,974 $1,392,423
Direct operating income ........................... $ 150,788 $ 146,765 $ 143,996
Retail operating income ........................... 73,660 72,136 56,193
Financial services operating income .................. 61,355 31,099 19,271
Other operating income (loss) ....................... (170,840) (152,785) (134,529)
Total operating income ........................ $ 114,963 $ 97,215 $ 84,931
As a Percentage of Total Revenue:
Direct revenue ................................... 57.6% 62.4% 66.4%
Retail revenue ................................... 34.5 32.1 29.2
Financial services revenue ......................... 6.5 5.0 4.2
Other revenue ................................... 1.1 0.5 0.2
Total revenue ................................ 100.0% 100.0% 100.0%
As a Percentage of Segment Revenue:
Direct operating income ........................... 14.5% 15.1% 15.6%
Retail operating income ........................... 11.9% 14.5% 13.8%
Financial services operating income .................. 52.8% 39.8% 33.1%
Total operating income (1) ......................... 6.4% 6.2% 6.1%
(1) The percentage set forth is a percentage of consolidated revenue rather than revenue by segment as it is
based upon our consolidated operating income. A separate line item is not included for Other operating
income as this amount is reflected in the total operating income amount, which reflects our consolidated
operating results.
36