Sysco 2010 Annual Report Download - page 13
Download and view the complete annual report
Please find page 13 of the 2010 Sysco annual report below. You can navigate through the pages in the report by either clicking on the pages listed below, or by using the keyword search tool below to find specific information within the annual report.-
 1
1 -
2
-
 3
3 -
 4
4 -
 5
5 -
 6
6 -
 7
7 -
 8
8 -
 9
9 -
 10
10 -
 11
11 -
 12
12 -
 13
13 -
 14
14 -
 15
15 -
 16
16 -
 17
17 -
 18
18 -
 19
19 -
 20
20 -
 21
21 -
 22
22 -
 23
23 -
24
-
25
-
26
-
27
-
28
-
29
-
30
-
31
-
32
-
33
-
34
-
35
-
36
-
37
-
38
-
39
-
40
-
41
-
42
-
43
-
44
-
45
-
46
-
47
-
48
-
49
-
50
-
51
-
52
-
53
-
54
-
55
-
56
-
57
-
58
-
59
-
60
-
61
-
62
-
63
-
64
-
65
-
66
-
67
-
68
-
69
-
70
-
71
-
72
-
73
-
74
-
75
-
76
-
77
-
78
-
79
-
80
-
81
-
82
-
83
-
84
-
85
-
86
-
87
-
88
-
89
-
90
-
91
-
92
-
93
-
94
-
95
-
96
-
97
-
98
-
99
-
100
-
101
-
102
 |
 |

2010 Annual Report 11
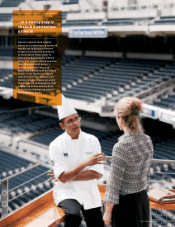
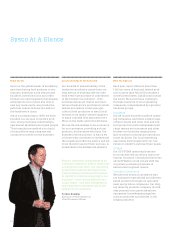
Leadership
From our founding by John Baugh, who
first envisioned a national foodservice
distribution network, Sysco has a his-
tory of strong leaders. The members
ofour senior management team are
respected across the industry for their
insight and commitment to the quality
of the foodservice business.
As the largest foodservice distributor
inNorth America, Sysco takes an active
role in industry associations such as the
International Foodservice Distributors
Association. We also provide support
atboth local and national levels to
nonprofit organizations that work to
endhunger.
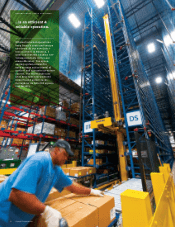
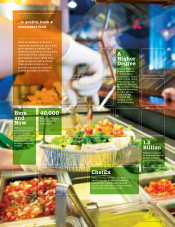
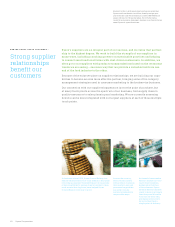
Breadth of Services
While food is at the heart of our business, Sysco offers a surprising breadth
ofproducts and services to support our customers, from restaurant design
consulting to kitchen composting systems.
We distribute kitchen equipment, dining room furniture, linens, dishes and
glassware; offer a wide selection of eco-friendly paper and disposable serving
items; and, through a new partnership with EcoLab, provide high-quality
cleaning and food safety items.
We also partner with a range of service providers who can design and print
menus, develop and buy advertising, repair an air conditioner, manage payrolls
and even provide insurance and employee benefits. These services, under our
aptly named Sysco iCare umbrella, leverage Sysco’s scale to benefit independent
restaurant owners.
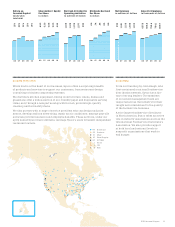
● 94 Broadline
● 32 Produce
● 15 Meat
● 15 Hotel Supply
◆ 20 SYGMA
▲ 1 Asian
▲ 1 IFG
▲ 2 RDC
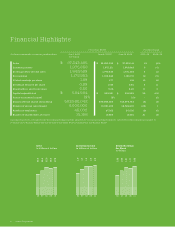
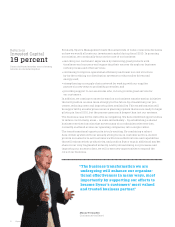
Return on
Invested Capital
equity plus
total debt
06
19%
07
20%
08
21%
09
19%
10
19%
Shareholders’ Equity
Per Share
in dollars
06
4.93
07
5.36
08
5.68
09
5.85
10
6.50
Net Cash Provided by
Operating Activities
in millions of dollars
06
1,120
07
1,416
08
1,570
09
1,577
10
885
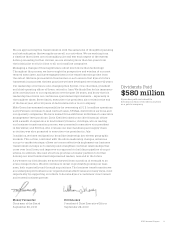
Dividends Declared
Per Share
in dollars
06
.66
07
.74
08
.85
09
.94
10
.99
Net Earnings
in millions of dollars
06
855
07
1,001
08
1,106
09
1,056
10
1,180
Sales Per Employee
in thousands of dollars
06
657.8
07
688.4
08
750.4
09
784.1
10
809.7