Sysco 2010 Annual Report Download - page 92
Download and view the complete annual report
Please find page 92 of the 2010 Sysco annual report below. You can navigate through the pages in the report by either clicking on the pages listed below, or by using the keyword search tool below to find specific information within the annual report.-
 1
1 -
2
-
3
-
4
-
5
-
6
-
7
-
8
-
9
-
10
-
11
-
12
-
13
-
14
-
15
-
16
-
17
-
18
-
19
-
20
-
21
-
22
-
23
-
24
-
25
-
26
-
27
-
28
-
29
-
30
-
31
-
32
-
33
-
34
-
35
-
36
-
37
-
38
-
39
-
40
-
41
-
42
-
43
-
44
-
45
-
46
-
47
-
48
-
49
-
50
-
51
-
52
-
53
-
54
-
55
-
56
-
57
-
58
-
59
-
60
-
61
-
62
-
63
-
64
-
65
-
66
-
67
-
68
-
69
-
70
-
71
-
72
-
73
-
74
-
75
-
76
-
77
-
78
-
79
-
80
-
81
-
 82
82 -
 83
83 -
 84
84 -
 85
85 -
 86
86 -
 87
87 -
 88
88 -
 89
89 -
 90
90 -
 91
91 -
 92
92 -
 93
93 -
 94
94 -
 95
95 -
 96
96 -
 97
97 -
 98
98 -
 99
99 -
 100
100 -
 101
101 -
 102
102
 |
 |

Sysco
Sysco
International
Other
Non-Guarantor
Subsidiaries Eliminations
Consolidated
Totals
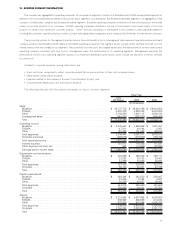
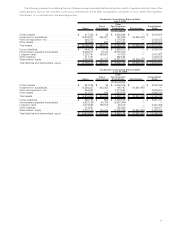
Condensed Consolidating Results of Operations
Year Ended July 3, 2010
(53 Weeks)
(In thousands)
Sales . . . ................................ $ — $ — $37,243,495 $ — $ 37,243,495
Cost of sales .............................. — — 30,136,009 — 30,136,009
Gross margin .............................. — — 7,107,486 — 7,107,486
Operating expenses ......................... 272,047 112 4,859,459 — 5,131,618
Operating income (loss) . ..................... (272,047) (112) 2,248,027 — 1,975,868
Interest expense (income) ..................... 496,410 10,961 (381,894) — 125,477
Other expense (income), net ................... 5,546 — (4,744) — 802
Earnings (losses) before income taxes . . .......... (774,003) (11,073) 2,634,665 — 1,849,589
Income tax (benefit) provision .................. (280,212) (4,009) 953,827 — 669,606
Equity in earnings of subsidiaries ................ 1,673,774 38,342 — (1,712,116) —
Net earnings .............................. $ 1,179,983 $ 31,278 $ 1,680,838 $ (1,712,116) $ 1,179,983
Sysco
Sysco
International
Other
Non-Guarantor
Subsidiaries Eliminations
Consolidated
Totals
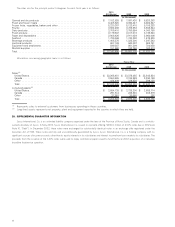
Condensed Consolidating Results of Operations
Year Ended June 27, 2009
(In thousands)
Sales . . . ................................ $ — $ — $36,853,330 $ — $ 36,853,330
Cost of sales .............................. — — 29,816,999 — 29,816,999
Gross margin .............................. — — 7,036,331 — 7,036,331
Operating expenses ......................... 218,241 117 4,945,762 — 5,164,120
Operating income (loss) . ..................... (218,241) (117) 2,090,569 — 1,872,211
Interest expense (income) ..................... 476,238 11,142 (371,058) — 116,322
Other (income), net ......................... (3,273) — (11,672) — (14,945)
Earnings (losses) before income taxes . . .......... (691,206) (11,259) 2,473,299 — 1,770,834
Income tax (benefit) provision .................. (279,041) (4,545) 998,472 — 714,886
Equity in earnings of subsidiaries ................ 1,468,113 44,626 — (1,512,739) —
Net earnings .............................. $ 1,055,948 $ 37,912 $ 1,474,827 $ (1,512,739) $ 1,055,948
Sysco
Sysco
International
Other
Non-Guarantor
Subsidiaries Eliminations
Consolidated
Totals
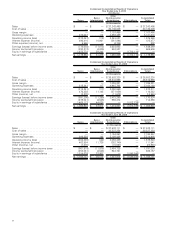
Condensed Consolidating Results of Operations
Year Ended June 28, 2008
(In thousands)
Sales . . . ................................ $ — $ — $37,522,111 $ — $ 37,522,111
Cost of sales .............................. — — 30,327,254 — 30,327,254
Gross margin .............................. — — 7,194,857 — 7,194,857
Operating expenses ......................... 206,338 142 5,108,428 — 5,314,908
Operating income (loss) . ..................... (206,338) (142) 2,086,429 — 1,879,949
Interest expense (income) ..................... 462,554 11,736 (362,749) — 111,541
Other (income), net ......................... (7,373) — (15,557) — (22,930)
Earnings (losses) before income taxes . . .......... (661,519) (11,878) 2,464,735 — 1,791,338
Income tax (benefit) provision .................. (253,031) (4,543) 942,761 — 685,187
Equity in earnings of subsidiaries ................ 1,514,639 33,907 — (1,548,546) —
Net earnings .............................. $ 1,106,151 $ 26,572 $ 1,521,974 $ (1,548,546) $ 1,106,151
68