Sysco 2010 Annual Report Download - page 79
Download and view the complete annual report
Please find page 79 of the 2010 Sysco annual report below. You can navigate through the pages in the report by either clicking on the pages listed below, or by using the keyword search tool below to find specific information within the annual report.-
 1
1 -
2
-
3
-
4
-
5
-
6
-
7
-
8
-
9
-
10
-
11
-
12
-
13
-
14
-
15
-
16
-
17
-
18
-
19
-
20
-
21
-
22
-
23
-
24
-
25
-
26
-
27
-
28
-
29
-
30
-
31
-
32
-
33
-
34
-
35
-
36
-
37
-
38
-
39
-
40
-
41
-
42
-
43
-
44
-
45
-
46
-
47
-
48
-
49
-
50
-
51
-
52
-
53
-
54
-
55
-
56
-
57
-
58
-
59
-
60
-
61
-
62
-
63
-
64
-
65
-
66
-
67
-
68
-
 69
69 -
 70
70 -
 71
71 -
 72
72 -
 73
73 -
 74
74 -
 75
75 -
 76
76 -
 77
77 -
 78
78 -
 79
79 -
 80
80 -
 81
81 -
 82
82 -
 83
83 -
 84
84 -
 85
85 -
 86
86 -
 87
87 -
 88
88 -
 89
89 -
90
-
91
-
92
-
93
-
94
-
95
-
96
-
97
-
98
-
99
-
100
-
101
-
102
 |
 |

Cash and cash equivalents: Valued at amortized cost, which approximates fair value. Cash and cash equivalents is included as a Level 2
measurement in the table below.
Equity securities: Valued at the closing price reported on the exchange market. If a stock is not listed on a public exchange, such as an American
Depository Receipt or some preferred stocks, the stock is valued using an evaluated bid price based on a compilation of observable market
information. Inputs used include yields, the underlying security “best price”, adjustments for corporate actions and exchange prices of underlying and
common stock of the same issuer. Equity securities valued at the closing price reported on the exchange market are classified as a Level 1
measurement in the table below; all other equity securities are included as a Level 2 measurement.
Fixed income securities: Valued using evaluated bid prices based on a compilation of observable market information or a broker quote in a non-
active market. Inputs used vary by type of security, but include spreads, yields, rate benchmarks, rate of prepayment, cash flows, rating changes and
collateral performance and type. All fixed income securities are included as a Level 2 measurement in the table below.
Investment funds: Valued at the net asset value (NAV) provided by the manager of each fund. The NAV is calculated as the underlying net
assets owned by the fund, divided by the number of shares outstanding. The NAV is based on the fair value of the underlying securities within the
fund. The real estate fund is valued at the NAV of shares held by the Retirement Plan, which is based on the valuations of the underlying real estate
investments held by the fund. Each real estate investment is valued on the basis of a discounted cash flow approach. Inputs used include future rental
receipts, expenses and residual values from a market participant view of the highest and best use of the real estate as rental property. All investment
funds, with the exception of the real estate fund, are included as a Level 2 measurement in the table below.The real estate fund is included as a Level 3
measurement.
Derivatives: Valuation method varies by type of derivative security.
•Credit default and interest rate swaps: Valued using evaluated bid prices based on a compilation of observable market information. Inputs
used for credit default swaps include spread curves and trade data about the credit quality of the counterparty. Inputs used for interest rate
swaps include benchmark yields, swap curves, cash flow analysis, and interdealer broker rates. Credit default and interest rate swaps are
included as a Level 2 measurement in the table below.
•Foreign currency contracts: Valued using a standardized interpolation model that utilizes the quoted prices for standard-length forward
foreign currency contracts and adjusts to the remaining term outstanding on the contract being valued. Foreign currency contracts are
included as a Level 2 measurement in the table below.
•Futures and option contracts: Valued at the closing price reported on the exchange market for exchange-traded futures and options.
Over-the-counter options are valued using pricing models that are based on observable market information. Exchange-traded futures and
options are included as a Level 1 measurement in the table below; over-the-counter options are included as a Level 2 measurement.
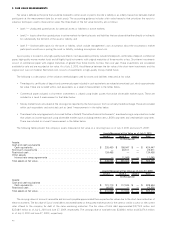
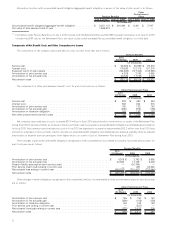
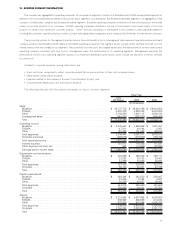
The following table presents the fair value of the Retirement Plan’s assets by major asset category as of July 3, 2010:
Level 1 Level 2 Level 3 Total
Assets Measured at Fair Value as of July 3, 2010
(In thousands)
Cash and cash equivalents
(1)
.......................... $ — $ 71,327 $ — $ 71,327
U.S. equity:
U.S. large-cap
(1)
................................. 259,621 161,228 — 420,849
U.S. small-to-mid-cap . . . .......................... 172,930 — — 172,930
International equity
(2)
............................. — 285,184 — 285,184
Fixed income long duration:
U.S. government and agency securities . . .............. — 178,097 — 178,097
Corporate bonds
(1)
............................... — 225,412 — 225,412
Asset-backed securities . .......................... — 12,108 — 12,108
Mortgage-backed securities, net
(3)
.................... — 124,312 — 124,312
Other
(1)
....................................... — 48,452 — 48,452
Derivatives, net
(4)
................................ 600 991 — 1,591
Fixed income high yield
(2)
............................ — 120,984 — 120,984
Alternative investments:
Real estate
(2)
................................... — — 17,065 17,065
Total investments at fair value......................... $ 433,151 $ 1,228,095 $ 17,065 $ 1,678,311
Other
(5)
........................................ (11,339)
Fair value of plan assets at end of year .................. $ 1,666,972
(1)
Include direct investments and investment funds.
(2)
Include investments in investment funds only.
(3)
Include direct investments, investment funds and forward settling sales.
(4)
Include credit default swaps, interest rate swaps, foreign currency contracts, futures and options. The fair value of asset positions totaled
$13.5 million; the fair value of liability positions totaled $11.9 million.
(5)
Include primarily plan receivables and payables, net.
55