Sysco 2010 Annual Report Download - page 43
Download and view the complete annual report
Please find page 43 of the 2010 Sysco annual report below. You can navigate through the pages in the report by either clicking on the pages listed below, or by using the keyword search tool below to find specific information within the annual report.-
 1
1 -
2
-
3
-
4
-
5
-
6
-
7
-
8
-
9
-
10
-
11
-
12
-
13
-
14
-
15
-
16
-
17
-
18
-
19
-
20
-
21
-
22
-
23
-
24
-
25
-
26
-
27
-
28
-
29
-
30
-
31
-
32
-
 33
33 -
 34
34 -
 35
35 -
 36
36 -
 37
37 -
 38
38 -
 39
39 -
 40
40 -
 41
41 -
 42
42 -
 43
43 -
 44
44 -
 45
45 -
 46
46 -
 47
47 -
 48
48 -
 49
49 -
 50
50 -
 51
51 -
 52
52 -
 53
53 -
54
-
55
-
56
-
57
-
58
-
59
-
60
-
61
-
62
-
63
-
64
-
65
-
66
-
67
-
68
-
69
-
70
-
71
-
72
-
73
-
74
-
75
-
76
-
77
-
78
-
79
-
80
-
81
-
82
-
83
-
84
-
85
-
86
-
87
-
88
-
89
-
90
-
91
-
92
-
93
-
94
-
95
-
96
-
97
-
98
-
99
-
100
-
101
-
102
 |
 |

cash surrender values. This compares to a $0.07 per share negative impact to earnings per share in fiscal 2009 from the losses recorded on the
adjustment of the carrying value of COLI policies to their cash surrender values.
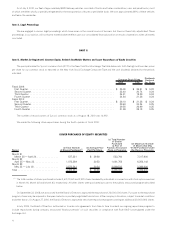
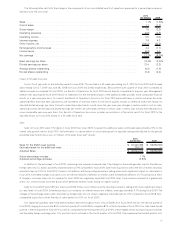
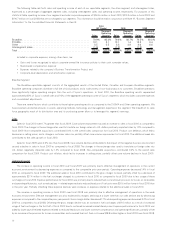
Set forth below is a reconciliation of actual diluted earnings per share to adjusted diluted earnings per share for the periods presented (see
further discussion at “Impact of 53-week fiscal year” above):
2010
(53 Weeks) 2009
Calculation of diluted earnings per share impact for 53rd week:
Estimated net earnings for the additional week ......................................... $ 24,127
Diluted shares outstanding ....................................................... 593,590,042
Estimated diluted earnings per share for the additional week ............................... $ 0.04
Diluted earnings per share for the 53/52 week periods . . . ................................. $ 1.99 $ 1.77
Estimated diluted earnings per share for the additional week ............................... 0.04 —
Adjusted diluted earnings per share ................................................. $ 1.95 $ 1.77
Actual percentage increase ....................................................... 12.4%
Adjusted percentage increase ..................................................... 10.2%
As compared to fiscal 2010, increased net company-sponsored pension costs and additional expense from our Business Transformation Project
will negatively impact both basic earnings per share and diluted earnings per share in fiscal 2011.
Segment Results
We have aggregated our operating companies into a number of segments, of which only Broadline and SYGMA are reportable segments as
defined in accounting provisions related to disclosures about segments of an enterprise. The accounting policies for the segments are the same as
those disclosed by Sysco within the Financial Statements and Supplementary Data within Part II Item 8 of this Form 10-K. Intersegment sales
generally represent specialty produce and meat company products distributed by the Broadline and SYGMA operating companies. The segment
results include certain centrally incurred costs for shared services that are charged to our segments.These centrally incurred costs are charged based
upon the relative level of service used by each operating company consistent with how management views the performance of its operating
segments.
Management evaluates the performance of each of our operating segments based on its respective operating income results, which include the
allocation of certain centrally incurred costs. While a segment’s operating income may be impacted in the short term by increases or decreases in
margins, expenses, or a combination thereof, over the long-term each business segment is expected to increase its operating income at a greater rate
than sales growth. This is consistent with our long-term goal of leveraging earnings growth at a greater rate than sales growth.
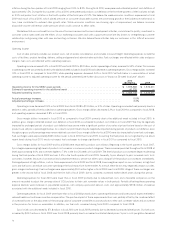
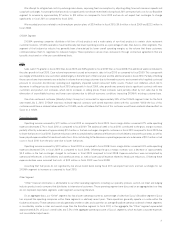
The following table sets forth the operating income of each of our reportable segments and the other segment expressed as a percentage of
each segment’s sales for each period reported and should be read in conjunction with Note 19, “Business Segment Information” to the Consolidated
Financial Statements in Item 8:
2010
(53 Weeks) 2009 2008
Operating Income as
a Percentage of Sales
Broadline ...................................................................... 7.0% 6.7% 6.5%
SYGMA ....................................................................... 1.0 0.6 0.2
Other ........................................................................ 3.9 3.1 3.8
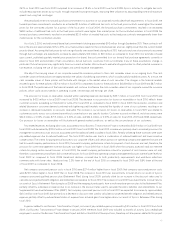
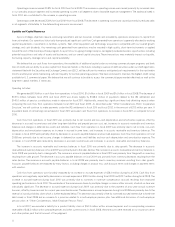
The following table sets forth the change in the selected financial data of each of our reportable segments and the other segment expressed as a
percentage increase over the prior year and should be read in conjunction with Note 19, “Business Segment Information” to the Consolidated
Financial Statements in Item 8:
Sales
Operating
Income Sales
Operating
Income
2010
(53 Weeks) 2009
Broadline ............................................................ 1.7% 5.9% (2.0)% 1.5%
SYGMA ............................................................. 1.1 56.7
(1)
5.8 265.5
(1)
Other .............................................................. (2.6) 20.8 (9.7) (25.8)
(1)
SYGMA had operating income of $47.3 million in fiscal 2010, $30.2 million in fiscal 2009 and $8.3 million in fiscal 2008.
19