Sysco 2010 Annual Report Download - page 93
Download and view the complete annual report
Please find page 93 of the 2010 Sysco annual report below. You can navigate through the pages in the report by either clicking on the pages listed below, or by using the keyword search tool below to find specific information within the annual report.-
 1
1 -
2
-
3
-
4
-
5
-
6
-
7
-
8
-
9
-
10
-
11
-
12
-
13
-
14
-
15
-
16
-
17
-
18
-
19
-
20
-
21
-
22
-
23
-
24
-
25
-
26
-
27
-
28
-
29
-
30
-
31
-
32
-
33
-
34
-
35
-
36
-
37
-
38
-
39
-
40
-
41
-
42
-
43
-
44
-
45
-
46
-
47
-
48
-
49
-
50
-
51
-
52
-
53
-
54
-
55
-
56
-
57
-
58
-
59
-
60
-
61
-
62
-
63
-
64
-
65
-
66
-
67
-
68
-
69
-
70
-
71
-
72
-
73
-
74
-
75
-
76
-
77
-
78
-
79
-
80
-
81
-
82
-
 83
83 -
 84
84 -
 85
85 -
 86
86 -
 87
87 -
 88
88 -
 89
89 -
 90
90 -
 91
91 -
 92
92 -
 93
93 -
 94
94 -
 95
95 -
 96
96 -
 97
97 -
 98
98 -
 99
99 -
 100
100 -
 101
101 -
 102
102
 |
 |

Sysco
Sysco
International
Other
Non-Guarantor
Subsidiaries
Consolidated
Totals
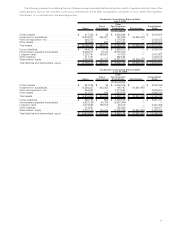
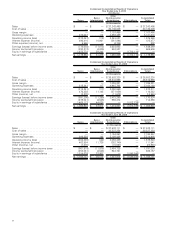
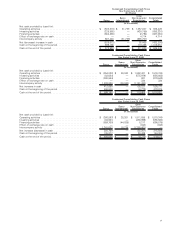
Condensed Consolidating Cash Flows
Year Ended July 3, 2010
(53 Weeks)
(In thousands)
Net cash provided by (used for):
Operating activities ...................................... $ (503,318) $ 31,739 $ 1,357,007 $ 885,428
Investing activities ...................................... (225,565) — (430,755) (656,320)
Financing activities ...................................... (664,236) — (2,794) (667,030)
Effect of exchange rate on cash ............................. — — 4,714 4,714
Intercompany activity .................................... 867,446 (31,739) (835,707) —
Net (decrease) increase in cash ............................. (525,673) — 92,465 (433,208)
Cash at the beginning of the period........................... 899,196 — 119,455 1,018,651
Cash at the end of the period ............................... $ 373,523 $ — $ 211,920 $ 585,443
Sysco
Sysco
International
Other
Non-Guarantor
Subsidiaries
Consolidated
Totals
Condensed Consolidating Cash Flows
Year Ended June 27, 2009
(In thousands)
Net cash provided by (used for):
Operating activities ...................................... $ (354,022) $ 38,340 $ 1,892,431 $ 1,576,749
Investing activities ...................................... (82,684) — (575,979) (658,663)
Financing activities ...................................... (380,564) — 921 (379,643)
Effect of exchange rate on cash ............................. — — 334 334
Intercompany activity .................................... 1,229,820 (38,340) (1,191,480) —
Net increase in cash ..................................... 412,550 — 126,227 538,777
Cash at the beginning of the period........................... 486,646 — (6,772) 479,874
Cash at the end of the period ............................... $ 899,196 $ — $ 119,455 $ 1,018,651
Sysco
Sysco
International
Other
Non-Guarantor
Subsidiaries
Consolidated
Totals
Condensed Consolidating Cash Flows
Year Ended June 28, 2008
(In thousands)
Net cash provided by (used for):
Operating activities ...................................... $ (266,597) $ 25,261 $ 1,811,685 $ 1,570,349
Investing activities ...................................... (64,561) — (490,999) (555,560)
Financing activities ...................................... (659,760) (44,035) 5,217 (698,578)
Effect of exchange rate on cash ............................. — — (643) (643)
Intercompany activity .................................... 1,341,687 18,774 (1,360,461) —
Net increase (decrease) in cash ............................. 350,769 — (35,201) 315,568
Cash at the beginning of the period........................... 135,877 — 28,429 164,306
Cash at the end of the period ............................... $ 486,646 $ — $ (6,772) $ 479,874
69