Sysco 2010 Annual Report Download - page 33
Download and view the complete annual report
Please find page 33 of the 2010 Sysco annual report below. You can navigate through the pages in the report by either clicking on the pages listed below, or by using the keyword search tool below to find specific information within the annual report.-
 1
1 -
2
-
3
-
4
-
5
-
6
-
7
-
8
-
9
-
10
-
11
-
12
-
13
-
14
-
15
-
16
-
17
-
18
-
19
-
20
-
21
-
22
-
 23
23 -
 24
24 -
 25
25 -
 26
26 -
 27
27 -
 28
28 -
 29
29 -
 30
30 -
 31
31 -
 32
32 -
 33
33 -
 34
34 -
 35
35 -
 36
36 -
 37
37 -
 38
38 -
 39
39 -
 40
40 -
 41
41 -
 42
42 -
 43
43 -
44
-
45
-
46
-
47
-
48
-
49
-
50
-
51
-
52
-
53
-
54
-
55
-
56
-
57
-
58
-
59
-
60
-
61
-
62
-
63
-
64
-
65
-
66
-
67
-
68
-
69
-
70
-
71
-
72
-
73
-
74
-
75
-
76
-
77
-
78
-
79
-
80
-
81
-
82
-
83
-
84
-
85
-
86
-
87
-
88
-
89
-
90
-
91
-
92
-
93
-
94
-
95
-
96
-
97
-
98
-
99
-
100
-
101
-
102
 |
 |

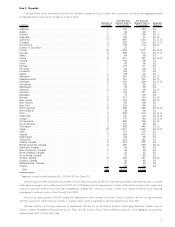
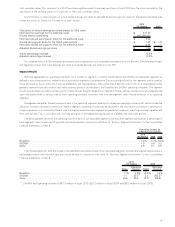
Item 2. Properties
The table below shows the number of distribution facilities occupied by Sysco in each state, province or country and the aggregate square
footage devoted to cold and dry storage as of July 3, 2010.
Location
Number of
Facilities
Cold Storage
(Square Feet in
Thousands)
Dry Storage
(Square Feet in
Thousands)
Segment
Served*
Alabama. .............................................. 2 184 228 BL
Alaska . . .............................................. 1 43 26 BL
Arizona . .............................................. 2 130 104 BL,O
Arkansas .............................................. 2 130 87 BL,O
California .............................................. 17 997 1,120 BL, S, O
Colorado .............................................. 4 283 214 BL,S,O
Connecticut ............................................ 3 165 116 BL,O
District of Columbia....................................... 1 22 3 O
Florida . . .............................................. 16 1,253 1,012 BL, S, O
Georgia . .............................................. 6 295 512 BL,S,O
Idaho . . . .............................................. 2 84 88 BL
Illinois . . .............................................. 5 371 387 BL,S,O
Indiana. . .............................................. 1 100 109 BL
Iowa . . . .............................................. 1 93 95 BL
Kansas. . .............................................. 1 177 171 BL
Kentucky .............................................. 1 92 106 BL
Louisiana .............................................. 1 134 113 BL
Maine . . .............................................. 1 59 50 BL
Maryland .............................................. 3 291 316 BL,O
Massachusetts .......................................... 2 161 207 BL,S
Michigan .............................................. 5 320 398 BL,S,O
Minnesota ............................................. 2 150 135 BL
Mississippi ............................................. 1 95 69 BL
Missouri. .............................................. 2 107 95 BL,S
Montana .............................................. 1 120 121 BL
Nebraska .............................................. 1 74 108 BL
Nevada . .............................................. 3 210 124 BL,O
New Jersey ............................................ 3 154 350 BL,O
New Mexico............................................ 1 120 108 BL
NewYork.............................................. 2 224 199 BL
North Carolina........................................... 6 329 429 BL,S,O
North Dakota ........................................... 1 46 59 BL
Ohio . . . .............................................. 9 390 518 BL,S,O
Oklahoma ............................................. 4 132 124 BL,S,O
Oregon . .............................................. 3 177 160 BL,S,O
Pennsylvania ........................................... 4 369 356 BL,S
South Carolina .......................................... 1 151 98 BL
Tennessee ............................................. 5 395 442 BL,O
Texas. . . .............................................. 19 1,081 1,097 BL, S, O
Utah . . . .............................................. 1 161 107 BL
Virginia . .............................................. 3 564 410 BL
Washington ............................................ 1 134 92 BL
Wisconsin ............................................. 2 287 242 BL
Alberta, Canada ......................................... 3 207 200 BL
British Columbia, Canada ................................... 8 283 326 BL,O
Manitoba, Canada ........................................ 1 58 46 BL
New Brunswick, Canada ................................... 2 48 56 BL
Newfoundland, Canada . ................................... 1 33 22 BL
Nova Scotia, Canada . . . ................................... 1 33 45 BL
Ontario, Canada ......................................... 9 402 361 BL,O
Quebec, Canada ......................................... 1 36 63 BL
Saskatchewan, Canada . ................................... 1 40 54 BL
Ireland . . .............................................. 1 38 40 BL
Total . . .............................................. 180 12,032 12,118
* Segments served include Broadline (BL), SYGMA (S) and Other (O).
We own approximately 19,634,000 square feet of our distribution facilities (or 81.0% of the total square feet), and the remainder is occupied
under leases expiring at various dates from fiscal 2011 to fiscal 2032, exclusive of renewal options. Certain of the facilities owned by the company are
subject to industrial revenue bond financing arrangements totaling $13.7 million as of July 3, 2010. Such industrial revenue bond financing
arrangements mature at various dates through fiscal 2026.
We own our approximately 625,000 square foot headquarters office complex in Houston, Texas. In addition, we own our approximately
661,000 square foot shared services complex in Cypress, Texas, which is expected to become operational in fiscal 2011.
We are currently constructing expansions or replacement facilities for our distribution facilities in Winnipeg, Manitoba, Canada; Toronto,
Ontario, Canada; Philadelphia, Pennsylvania; Austin, Texas; and San Antonio, Texas. These operating companies, in the aggregate, accounted for
approximately 3.6% of fiscal 2010 sales.
9