Sysco 2010 Annual Report Download - page 39
Download and view the complete annual report
Please find page 39 of the 2010 Sysco annual report below. You can navigate through the pages in the report by either clicking on the pages listed below, or by using the keyword search tool below to find specific information within the annual report.-
 1
1 -
2
-
3
-
4
-
5
-
6
-
7
-
8
-
9
-
10
-
11
-
12
-
13
-
14
-
15
-
16
-
17
-
18
-
19
-
20
-
21
-
22
-
23
-
24
-
25
-
26
-
27
-
28
-
 29
29 -
 30
30 -
 31
31 -
 32
32 -
 33
33 -
 34
34 -
 35
35 -
 36
36 -
 37
37 -
 38
38 -
 39
39 -
 40
40 -
 41
41 -
 42
42 -
 43
43 -
 44
44 -
 45
45 -
 46
46 -
 47
47 -
 48
48 -
 49
49 -
50
-
51
-
52
-
53
-
54
-
55
-
56
-
57
-
58
-
59
-
60
-
61
-
62
-
63
-
64
-
65
-
66
-
67
-
68
-
69
-
70
-
71
-
72
-
73
-
74
-
75
-
76
-
77
-
78
-
79
-
80
-
81
-
82
-
83
-
84
-
85
-
86
-
87
-
88
-
89
-
90
-
91
-
92
-
93
-
94
-
95
-
96
-
97
-
98
-
99
-
100
-
101
-
102
 |
 |

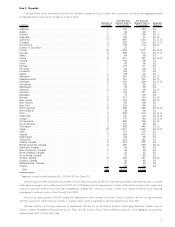
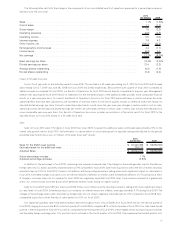
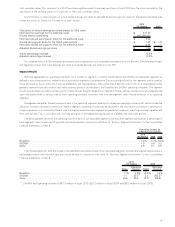
The following table sets forth the change in the components of our consolidated results of operations expressed as a percentage increase or
decrease over the prior year:
2010
(53 Weeks) 2009
Sales ........................................................................... 1.1% (1.8)%
Cost of sales ..................................................................... 1.1 (1.7)
Gross margin ..................................................................... 1.0 (2.2)
Operating expenses ................................................................ (0.6) (2.8)
Operating income .................................................................. 5.5 (0.4)
Interest expense................................................................... 7.9 4.3
Other income, net ................................................................. (105.4) (34.8)
Earnings before income taxes ......................................................... 4.4 (1.1)
Income taxes ..................................................................... (6.3) 4.3
Net earnings ..................................................................... 11.7% (4.5)%
Basic earnings per share . . ........................................................... 12.4% (3.3)%
Diluted earnings per share . ........................................................... 12.4 (2.2)
Average shares outstanding ........................................................... (0.5) (1.8)
Diluted shares outstanding. ........................................................... (0.4) (2.4)
Impact of 53-week fiscal year
Sysco’s fiscal year ends on the Saturday nearest to June 30th. This resulted in a 53-week year ending July 3, 2010 for fiscal 2010 and 52-week
years ending June 27, 2009 and June 28, 2008 for fiscal 2009 and 2008, respectively. Because the fourth quarter of fiscal 2010 contained an
additional week as compared to fiscal 2009, our Results of Operations for fiscal 2010 are not directly comparable to the prior year. Management
believes that adjusting the fiscal 2010 Results of Operations for the estimated impact of the additional week provides more comparable financial
results on a year-over-year basis. As a result, the Results of Operations discussion for fiscal 2010 presented below in certain instances discusses
operating items that have been adjusted by one-fourteenth of the total metric for the fourth quarter, except as otherwise noted with respect to
adjusted diluted earnings per share. Failure to make these adjustments would cause the year-over-year changes in certain metrics such as sales,
operating income, net earnings and diluted earnings per share to be overstated, whereas in certain cases, a metric may actually have declined on a
more comparable year-over-year basis. Our Results of Operations discussion includes reconciliations of the actual results for fiscal 2010 to the
adjusted results for fiscal 2010 based on a 52-week fiscal year.
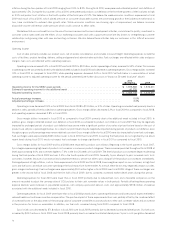
Sales
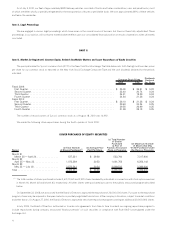
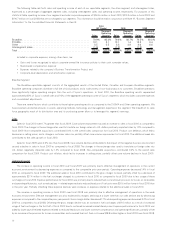
Sales for fiscal 2010 were 1.1% higher in fiscal 2010 than fiscal 2009, however the additional week contributed approximately 2.0% to the
overall sales growth rate for fiscal 2010. Set forth below is a reconciliation of actual sales growth to adjusted sales growth/decline for the periods
presented (see further discussion at “Impact of 53-week fiscal year” above):
2010
(53 Weeks) 2009
Sales for the 53/52 week periods ............................................... $ 37,243,495 $ 36,853,330
Estimated sales for the additional week . ......................................... 739,177 —
Adjusted Sales............................................................ $ 36,504,318 $ 36,853,330
Actual percentage increase ................................................... 1.1%
Adjusted percentage decrease ................................................. (0.9)%
In addition to the extra week in fiscal 2010, improving case volumes increased sales. The changes in the exchange rates used to translate our
foreign sales into U.S. dollars positively impacted sales by 0.9% compared to fiscal 2009. Sales from acquisitions within the last 12 months favorably
impacted sales by 0.5% for fiscal 2010. Product cost deflation and the resulting decrease in selling prices had a significant impact on sales levels in
fiscal 2010. Estimated changes in product costs, an internal measure of deflation or inflation, were estimated as deflation of 1.5% during fiscal 2010.
A change in customer sales mix as compared to fiscal 2009 also negatively impacted fiscal 2010 sales. Case volumes increased at a greater rate
within our contract based customer group which generally receives lower pricing for higher volume.
Sales for fiscal 2009 were 1.8% less than fiscal 2008. Product cost inflation and the resulting increase in selling prices had a significant impact
on sales levels in fiscal 2009. Estimated product cost increases, an internal measure of inflation, were approximately 4.7% during fiscal 2009. The
changes in the exchange rates used to translate our foreign sales into U.S. dollars negatively impacted sales by 1.2% compared to fiscal 2008. Non-
comparable acquisitions offset the rate of sales decline by 0.2% for fiscal 2009.
Our sequential quarterly sales trend demonstrated a decline throughout most of fiscal 2008, all of fiscal 2009 and into the second quarter of
fiscal 2010, ranging from a positive 8.5% in the first quarter of fiscal 2008 to a negative 8.1% in the first quarter of fiscal 2010. Our sales trend turned
positive in the third quarter of fiscal 2010 to 2.4% as compared to the third quarter of fiscal 2009, a result largely driven by improving case volumes
and favorable foreign exchange rates. This positive trend continued in the fourth quarter of fiscal 2010. We experienced estimated product cost
15