Sysco 2010 Annual Report Download - page 94
Download and view the complete annual report
Please find page 94 of the 2010 Sysco annual report below. You can navigate through the pages in the report by either clicking on the pages listed below, or by using the keyword search tool below to find specific information within the annual report.-
 1
1 -
2
-
3
-
4
-
5
-
6
-
7
-
8
-
9
-
10
-
11
-
12
-
13
-
14
-
15
-
16
-
17
-
18
-
19
-
20
-
21
-
22
-
23
-
24
-
25
-
26
-
27
-
28
-
29
-
30
-
31
-
32
-
33
-
34
-
35
-
36
-
37
-
38
-
39
-
40
-
41
-
42
-
43
-
44
-
45
-
46
-
47
-
48
-
49
-
50
-
51
-
52
-
53
-
54
-
55
-
56
-
57
-
58
-
59
-
60
-
61
-
62
-
63
-
64
-
65
-
66
-
67
-
68
-
69
-
70
-
71
-
72
-
73
-
74
-
75
-
76
-
77
-
78
-
79
-
80
-
81
-
82
-
83
-
 84
84 -
 85
85 -
 86
86 -
 87
87 -
 88
88 -
 89
89 -
 90
90 -
 91
91 -
 92
92 -
 93
93 -
 94
94 -
 95
95 -
 96
96 -
 97
97 -
 98
98 -
 99
99 -
 100
100 -
 101
101 -
 102
102
 |
 |

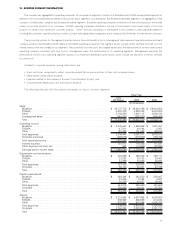
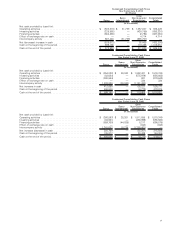
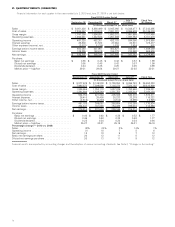
21. QUARTERLY RESULTS ( UNAUDITED)
Financial information for each quarter in the years ended July 3, 2010 and June 27, 2009 is set forth below:
September 26 December 26 March 27
July 3
(14 Weeks)
Fiscal Year
(53 Weeks)
Fiscal 2010 Quarter Ended
(In thousands except for per share data)
Sales .................................. $ 9,081,426 $ 8,868,499 $ 8,945,093 $ 10,348,477 $ 37,243,495
Cost of sales............................. 7,334,067 7,173,612 7,261,721 8,366,609 30,136,009
Gross margin ............................ 1,747,359 1,694,887 1,683,372 1,981,868 7,107,486
Operating expenses ........................ 1,250,031 1,232,536 1,251,269 1,397,782 5,131,618
Operating income ......................... 497,328 462,351 432,103 584,086 1,975,868
Interest expense .......................... 33,800 31,522 27,654 32,501 125,477
Other expense (income), net .................. (2,012) (1,138) 1,028 2,924 802
Earnings before income taxes ................. 465,540 431,967 403,421 548,661 1,849,589
Income taxes ............................ 139,335 163,618 155,773 210,880 669,606
Net earnings ............................. $ 326,205 $ 268,349 $ 247,648 $ 337,781 $ 1,179,983
Per share:
Basic net earnings ....................... $ 0.55 $ 0.45 $ 0.42 $ 0.57 $ 1.99
Diluted net earnings . . . ................... 0.55 0.45 0.42 0.57 1.99
Dividends declared ....................... 0.24 0.25 0.25 0.25 0.99
Market price — high/low ................... 26-21 29-24 30-27 32-28 32-21
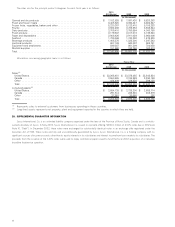
September 27 December 27 March 28 June 27 Fiscal Year
Fiscal 2009 Quarter Ended
(In thousands except for per share data)
Sales ................................... $ 9,877,429 $ 9,149,803 $ 8,739,350 $ 9,086,748 $ 36,853,330
Cost of sales . ............................ 7,990,873 7,399,690 7,102,274 7,324,162 29,816,999
Gross margin . ............................ 1,886,556 1,750,113 1,637,076 1,762,586 7,036,331
Operating expenses......................... 1,381,804 1,328,249 1,231,753 1,222,314 5,164,120
Operating income .......................... 504,752 421,864 405,323 540,272 1,872,211
Interest expense ........................... 26,410 28,400 28,233 33,279 116,322
Other income, net .......................... (2,813) (5,223) (3,514) (3,395) (14,945)
Earnings before income taxes . ................. 481,155 398,687 380,604 510,388 1,770,834
Income taxes . ............................ 204,341 161,033 154,438 195,074 714,886
Net earnings . . ............................ $ 276,814 $ 237,654 $ 226,166 $ 315,314 $ 1,055,948
Per share:
Basic net earnings ........................ $ 0.46 $ 0.40 $ 0.38 $ 0.53 $ 1.77
Diluted net earnings ....................... 0.46 0.40 0.38 0.53 1.77
Dividends declared ........................ 0.22 0.24 0.24 0.24 0.94
Market price — high/low . . . ................. 35-27 33-21 25-19 25-21 35-19
Percentage change — 2010 vs. 2009:
Sales ................................... (8)% (3)% 2% 14% 1%
Operating income .......................... (1) 10 7 8 6
Net earnings . . ............................ 18 13 9 7 12
Basic net earnings per share. . ................. 20 13 11 8 12
Diluted net earnings per share ................. 20 13 11 8 12
Financial results are impacted by accounting changes and the adoption of various accounting standards. See Note 2, “Changes in Accounting.”
70