Sysco 2010 Annual Report Download - page 89
Download and view the complete annual report
Please find page 89 of the 2010 Sysco annual report below. You can navigate through the pages in the report by either clicking on the pages listed below, or by using the keyword search tool below to find specific information within the annual report.-
 1
1 -
2
-
3
-
4
-
5
-
6
-
7
-
8
-
9
-
10
-
11
-
12
-
13
-
14
-
15
-
16
-
17
-
18
-
19
-
20
-
21
-
22
-
23
-
24
-
25
-
26
-
27
-
28
-
29
-
30
-
31
-
32
-
33
-
34
-
35
-
36
-
37
-
38
-
39
-
40
-
41
-
42
-
43
-
44
-
45
-
46
-
47
-
48
-
49
-
50
-
51
-
52
-
53
-
54
-
55
-
56
-
57
-
58
-
59
-
60
-
61
-
62
-
63
-
64
-
65
-
66
-
67
-
68
-
69
-
70
-
71
-
72
-
73
-
74
-
75
-
76
-
77
-
78
-
 79
79 -
 80
80 -
 81
81 -
 82
82 -
 83
83 -
 84
84 -
 85
85 -
 86
86 -
 87
87 -
 88
88 -
 89
89 -
 90
90 -
 91
91 -
 92
92 -
 93
93 -
 94
94 -
 95
95 -
 96
96 -
 97
97 -
 98
98 -
 99
99 -
100
-
101
-
102
 |
 |

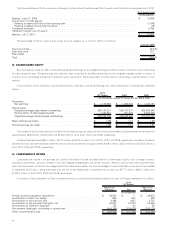
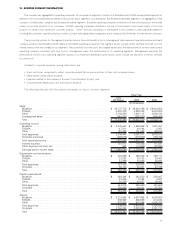
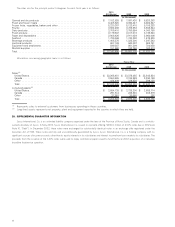
19. BUSINESS SEGMENT INFORMATION
The company has aggregated its operating companies into a number of segments, of which only Broadline and SYGMA are reportable segments as
defined in the accounting literature related to disclosures about segments of an enterprise. The Broadline reportable segment is an aggregation of the
company’s United States, Canadian and European Broadline segments. Broadline operating companies distribute a full line of food products and a wide
variety of non-food products to its customers. SYGMA operating companies distribute a full line of food products and a wide variety of non-food
products to certain chain restaurant customer locations. “Other” financial information is attributable to the company’s other operating segments,
including the company’s specialty produce, custom-cut meat and lodging industry segments and a company that distributes to international customers.
The accounting policies for the segments are the same as those disclosed by Sysco. Intersegment sales represent specialty produce and meat
company products distributed by the Broadline and SYGMA operating companies. The segment results include certain centrally incurred costs for
shared services that are charged to our segments. These centrally incurred costs are charged based upon the relative level of service used by each
operating company consistent with how Sysco’s management views the performance of its operating segments. Management evaluates the
performance of each of our operating segments based on its respective operating income results, which include the allocation of certain centrally
incurred costs.
Included in corporate expenses, among other items, are:
• Gains and losses recognized to adjust corporate-owned life insurance policies to their cash surrender values;
• Share-based compensation expense;
• Expenses related to the company’s Business Transformation Project; and
• Corporate-level depreciation and amortization expense.
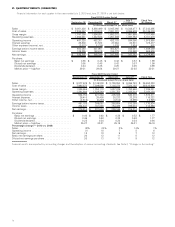
The following table sets forth the financial information for Sysco’s business segments:
2010
(53 Weeks) 2009 2008
Fiscal Year
(In thousands)
Sales:
Broadline . . ................................................. $ 29,737,718 $ 29,234,199 $ 29,824,553
SYGMA . . . ................................................. 4,891,279 4,839,036 4,574,880
Other ..................................................... 3,158,855 3,242,115 3,590,738
Intersegment sales ............................................ (544,357) (462,020) (468,060)
Total ...................................................... $ 37,243,495 $ 36,853,330 $ 37,522,111
Operating income:
Broadline . . ................................................. $ 2,075,647 $ 1,959,963 $ 1,931,881
SYGMA . . . ................................................. 47,311 30,193 8,261
Other ..................................................... 122,483 101,355 136,533
Total segments............................................... 2,245,441 2,091,511 2,076,675
Corporate expenses ........................................... (269,573) (219,300) (196,726)
Total operating income ......................................... 1,975,868 1,872,211 1,879,949
Interest expense.............................................. 125,477 116,322 111,541
Other expense (income), net ..................................... 802 (14,945) (22,930)
Earnings before income taxes .................................... $ 1,849,589 $ 1,770,834 $ 1,791,338
Depreciation and amortization:
Broadline . . ................................................. $ 275,639 $ 265,526 $ 258,171
SYGMA . . . ................................................. 23,822 26,753 30,467
Other ..................................................... 34,389 37,629 36,692
Total segments............................................... 333,850 329,908 325,330
Corporate . ................................................. 56,126 52,431 47,199
Total ...................................................... $ 389,976 $ 382,339 $ 372,529
Capital expenditures:
Broadline . . ................................................. $ 393,824 $ 342,550 $ 393,067
SYGMA . . . ................................................. 25,436 5,053 4,977
Other ..................................................... 25,259 40,857 36,565
Total segments............................................... 444,519 388,460 434,609
Corporate . ................................................. 150,085 76,101 81,354
Total ...................................................... $ 594,604 $ 464,561 $ 515,963
Assets:
Broadline . . ................................................. $ 6,218,985 $ 5,637,998 $ 5,809,060
SYGMA . . . ................................................. 392,883 366,539 414,044
Other ..................................................... 937,605 914,764 1,005,740
Total segments............................................... 7,549,473 6,919,301 7,228,844
Corporate . ................................................. 2,764,228 3,228,885 2,781,771
Total ...................................................... $ 10,313,701 $ 10,148,186 $ 10,010,615
65