Sysco 2010 Annual Report Download - page 55
Download and view the complete annual report
Please find page 55 of the 2010 Sysco annual report below. You can navigate through the pages in the report by either clicking on the pages listed below, or by using the keyword search tool below to find specific information within the annual report.-
 1
1 -
2
-
3
-
4
-
5
-
6
-
7
-
8
-
9
-
10
-
11
-
12
-
13
-
14
-
15
-
16
-
17
-
18
-
19
-
20
-
21
-
22
-
23
-
24
-
25
-
26
-
27
-
28
-
29
-
30
-
31
-
32
-
33
-
34
-
35
-
36
-
37
-
38
-
39
-
40
-
41
-
42
-
43
-
44
-
 45
45 -
 46
46 -
 47
47 -
 48
48 -
 49
49 -
 50
50 -
 51
51 -
 52
52 -
 53
53 -
 54
54 -
 55
55 -
 56
56 -
 57
57 -
 58
58 -
 59
59 -
 60
60 -
 61
61 -
 62
62 -
 63
63 -
 64
64 -
 65
65 -
66
-
67
-
68
-
69
-
70
-
71
-
72
-
73
-
74
-
75
-
76
-
77
-
78
-
79
-
80
-
81
-
82
-
83
-
84
-
85
-
86
-
87
-
88
-
89
-
90
-
91
-
92
-
93
-
94
-
95
-
96
-
97
-
98
-
99
-
100
-
101
-
102
 |
 |

circumstances and individuals beyond the control of Sysco. The need for additional borrowing or other capital is impacted by factors that include
capital expenditures or acquisitions in excess of those currently anticipated, stock repurchases at historical levels, or other unexpected cash
requirements. Predictions regarding the future adoption of accounting pronouncements involve estimates without the benefit of precedent, and if
our estimates turn out to be materially incorrect, our assessment of the impact of the pronouncement could prove incorrect, as well. The anticipated
impact of compliance with laws and regulations also involves the risk that estimates may turn out to be materially incorrect, and laws and
regulations, as well as methods of enforcement, are subject to change.
Item 7A. Quantitative and Qualitative Disclosures About Market Risk
Interest Rate Risk
We do not utilize financial instruments for trading purposes. Our use of debt directly exposes us to interest rate risk. Floating rate debt, where
the interest rate fluctuates periodically, exposes us to short-term changes in market interest rates. Fixed rate debt, where the interest rate is fixed
over the life of the instrument, exposes us to changes in market interest rates reflected in the fair value of the debt and to the risk that we may need to
refinance maturing debt with new debt at higher rates.
We manage our debt portfolio to achieve an overall desired position of fixed and floating rates and may employ interest rate swaps as a tool to
achieve that position. The major risks from interest rate derivatives include changes in the interest rates affecting the fair value of such instruments,
potential increases in interest expense due to market increases in floating interest rates and the creditworthiness of the counterparties in such
transactions.
Fiscal 2010
As of July 3, 2010, we had no commercial paper outstanding. Our long-term debt obligations as of July 3, 2010 were $2.5 billion, of which
approximately 81% were at fixed rates of interest, including the impact of our interest rate swap agreements.
In September 2009, we entered into an interest rate swap agreement that effectively converted $200.0 million of fixed rate debt maturing in
fiscal 2014 to floating rate debt (2014 swap). In October 2009, we entered into an interest rate swap agreement that effectively converted
$250.0 million of fixed rate debt maturing in fiscal 2013 to floating rate debt (2013 swap). Both transactions were entered into with the goal of
reducing overall borrowing cost and increasing floating interest rate exposure. The major risks from interest rate derivatives include changes in
interest rates affecting the fair value of such instruments, potential increases in interest expense due to market increases in floating interest rates and
the creditworthiness of the counterparties in such transactions. These transactions were designated as fair value hedges since the swaps hedge
against the changes in fair value of fixed rate debt resulting from changes in interest rates.
As of July 3, 2010, the 2014 swap was recognized as an asset within the consolidated balance sheet at fair value within other assets of
$5.5 million. The fixed interest rate on the hedged debt is 4.6% and the floating interest rate on the swap is three-month LIBOR which resets
quarterly. As of July 3, 2010, the 2013 swap was recognized as an asset within the consolidated balance sheet at fair value within other assets of
$5.5 million. The fixed interest rate on the hedged debt is 4.2% and the floating interest rate on the swap is three-month LIBOR which resets
quarterly.
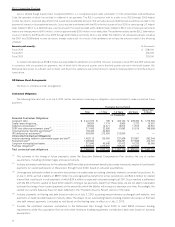
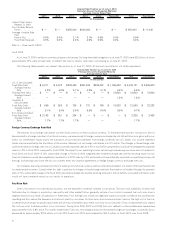
The following tables present our interest rate position as of July 3, 2010. All amounts are stated in U.S. dollar equivalents.
2011 2012 2013 2014 2015 Thereafter Total Fair Value
Interest Rate Position as of July 3, 2010
Principal Amount by Expected Maturity
Average Interest Rate
(In thousands)
U.S. $ Denominated:
Fixed Rate Debt ........ $ 6,250 $ 204,658 $ 2,471 $ 1,275 $ 552 $1,766,234 $1,981,440 $2,262,961
Average Interest Rate . . . 4.5% 6.1% 4.7% 4.0% 3.5% 5.8% 5.9%
Floating Rate Debt
(1)
. . . . . $ — $ — $ 252,801 $ 208,249 $ 1,100 $ 12,500 $ 474,650 $ 483,872
Average Interest Rate . . . — — 2.5% 2.2% 0.3% 0.6% 2.3%
Canadian $ Denominated:
Fixed Rate Debt ........ $ 894 $ 957 $ 944 $ 979 $ 1,061 $ 18,676 $ 23,511 $ 26,851
Average Interest Rate . . . 7.6% 8.0% 8.8% 9.1% 9.2% 9.8% 9.5%
Euro cDenominated:
Fixed Rate Debt ........ $ 826 $ 205 $ — $ — $ — $ — $ 1,031 $ 1,177
Average Interest Rate . . . 8.9% 8.9% 0.0% 0.0% — — 8.9%
(1)
Includes fixed rate debt that has been converted to floating rate debt through interest rate swap agreements.
31