Sysco 2010 Annual Report Download - page 40
Download and view the complete annual report
Please find page 40 of the 2010 Sysco annual report below. You can navigate through the pages in the report by either clicking on the pages listed below, or by using the keyword search tool below to find specific information within the annual report.-
 1
1 -
2
-
3
-
4
-
5
-
6
-
7
-
8
-
9
-
10
-
11
-
12
-
13
-
14
-
15
-
16
-
17
-
18
-
19
-
20
-
21
-
22
-
23
-
24
-
25
-
26
-
27
-
28
-
29
-
 30
30 -
 31
31 -
 32
32 -
 33
33 -
 34
34 -
 35
35 -
 36
36 -
 37
37 -
 38
38 -
 39
39 -
 40
40 -
 41
41 -
 42
42 -
 43
43 -
 44
44 -
 45
45 -
 46
46 -
 47
47 -
 48
48 -
 49
49 -
 50
50 -
51
-
52
-
53
-
54
-
55
-
56
-
57
-
58
-
59
-
60
-
61
-
62
-
63
-
64
-
65
-
66
-
67
-
68
-
69
-
70
-
71
-
72
-
73
-
74
-
75
-
76
-
77
-
78
-
79
-
80
-
81
-
82
-
83
-
84
-
85
-
86
-
87
-
88
-
89
-
90
-
91
-
92
-
93
-
94
-
95
-
96
-
97
-
98
-
99
-
100
-
101
-
102
 |
 |

inflation during the four quarters of fiscal 2009 ranging from 0.5% to 8.3%. During fiscal 2010, we experienced estimated product cost deflation of
approximately 1.5%. During the four quarters of fiscal 2010, we experienced product cost deflation in the first three quarters of the fiscal year as high
as 3.5% and product cost inflation in the fourth quarter of the fiscal year of 2.2%. We believe the weak economic conditions experienced in fiscal
2009 and much of fiscal 2010, which placed pressure on consumer disposable income, are constricting growth in the foodservice market and, in
turn, have contributed to reduced sales growth rates. While economic conditions are showing signs of improvement, we believe consumer
disposable income will remain under pressure, which could continue to affect sales.
We believe that our continued focus on the use of business reviews and business development activities, commitment to quality, investment in
customer contact personnel and the efforts of our marketing associates and sales support personnel are key drivers to strengthening customer
relationships and growing sales with new and existing customers. We also believe these activities help our customers in this difficult economic
environment.
Operating Income
Cost of sales primarily includes our product costs, net of vendor consideration, and includes in-bound freight. Operating expenses include the
costs of facilities, product handling, delivery, selling and general and administrative activities. Fuel surcharges are reflected within sales and gross
margins; fuel costs are reflected within operating expenses.
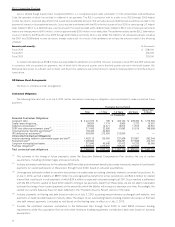
Operating income increased 5.5% in fiscal 2010 from fiscal 2009 to $2.0 billion, and as a percentage of sales, increased to 5.3% of sales.This increase
in operating income was primarily driven by the additional week included in fiscal 2010 and a decrease in operating expenses. Gross margin dollars increased
1.0% in fiscal 2010 as compared to fiscal 2009, while operating expenses decreased 0.6% in fiscal 2010. Set forth below is a reconciliation of actual
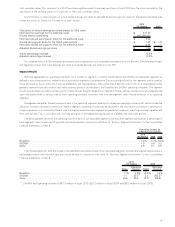
operating income to adjusted operating income for the periods presented (see further discussion at “Impact of 53-week fiscal year” above):
2010
(53 Weeks) 2009
Operating income for the 53/52 week periods ........................................ $ 1,975,868 $ 1,872,211
Estimated operating income for the additional week ................................... 41,720 —
Adjusted operating income ..................................................... $ 1,934,148 $ 1,872,211
Actual percentage increase ..................................................... 5.5%
Adjusted percentage increase ................................................... 3.3%
Operating income decreased 0.4% in fiscal 2009 from fiscal 2008 to $1.9 billion, or 5.1% of sales. Operating income declined primarily due to a
decline in sales, partially offset by a decline in operating expenses. Gross margin dollars decreased 2.2% in fiscal 2009 as compared to fiscal 2008,
and operating expenses decreased 2.8% in fiscal 2009.
Gross margin dollars increased in fiscal 2010 as compared to fiscal 2009 primarily due to the additional week included in fiscal 2010. In
addition, gross margins reflected product cost deflation in fiscal 2010 as compared to product cost inflation in fiscal 2009. We may be negatively
impacted by prolonged periods of product cost deflation because we make a significant portion of our sales at prices that are based on the cost of
products we sell plus a percentage markup. As a result, our profit levels may be negatively impacted during periods of product cost deflation, even
though our gross profit percentage may remain relatively constant. Gross margin dollars for fiscal 2010 were also impacted by lower fuel surcharges.
Fuel surcharges were approximately $18.5 million lower in fiscal 2010 than fiscal 2009. Assuming that fuel prices do not significantly rise above
recent levels during fiscal 2011, we do not expect fuel surcharges to change significantly in fiscal 2011 as compared to fiscal 2010.
Gross margin dollars for fiscal 2009 and fiscal 2008 were impacted by product cost inflation. Beginning in the fourth quarter of fiscal 2007,
Sysco began experiencing high levels of product cost increases in numerous product categories. These increases persisted throughout fiscal 2008 at
levels approximating 6.0% and rose even higher to 7.6% in the first 26 weeks of fiscal 2009. The level of product cost increases began moderating
during the third quarter of fiscal 2009 and was 0.5% in the fourth quarter of fiscal 2009. Generally, Sysco attempts to pass increased costs to its
customers; however, because of contractual and competitive reasons, we are not able to pass along all of the product cost increases immediately.
Prolonged periods of high inflation, such as those experienced in fiscal 2009 and fiscal 2008, have a negative impact on our customers, as high food
costs and fuel costs can reduce consumer spending in the food-away-from home market. As a result, these factors may negatively impact our sales,
gross margins and earnings. Fuel surcharges were approximately $5.0 million higher in fiscal 2009 over fiscal 2008. Usage of these surcharges was
greater in the second half of fiscal 2008 and the first half of fiscal 2009, due to sustained, increased market diesel prices during that period.
Operating expenses for fiscal 2010 were lower than in fiscal 2009 primarily due to reduced fuel costs and a favorable comparison on the
amounts recorded to adjust the carrying value of COLI policies to their cash surrender values in both periods. Partially offsetting these operating
expense declines were increases in pay-related expenses, net company-sponsored pension costs and approximately $99.8 million of expense
associated with the additional week included in fiscal 2010.
Operating expenses for fiscal 2009 were lower than in fiscal 2008 primarily due to operating efficiencies and lower payroll expense related to
reduced headcount and lower incentive compensation. The positive impact of these expense reductions was partially offset by the combined effect
of increased losses on the adjustment of the carrying value of corporate-owned life insurance policies to their cash surrender values and an increase
in the provision for losses on receivables. In addition, our fuel costs increased during fiscal 2009 compared to fiscal 2008.
Sysco’s fuel costs decreased by $71.8 million in fiscal 2010 over fiscal 2009 primarily due to decreased contracted diesel prices. Our fuel costs
increased by $33.2 million in fiscal 2009 over fiscal 2008 primarily due to increased contracted diesel prices. Sysco’s costs per gallon decreased
16