Sysco 2010 Annual Report Download - page 44
Download and view the complete annual report
Please find page 44 of the 2010 Sysco annual report below. You can navigate through the pages in the report by either clicking on the pages listed below, or by using the keyword search tool below to find specific information within the annual report.-
 1
1 -
2
-
3
-
4
-
5
-
6
-
7
-
8
-
9
-
10
-
11
-
12
-
13
-
14
-
15
-
16
-
17
-
18
-
19
-
20
-
21
-
22
-
23
-
24
-
25
-
26
-
27
-
28
-
29
-
30
-
31
-
32
-
33
-
 34
34 -
 35
35 -
 36
36 -
 37
37 -
 38
38 -
 39
39 -
 40
40 -
 41
41 -
 42
42 -
 43
43 -
 44
44 -
 45
45 -
 46
46 -
 47
47 -
 48
48 -
 49
49 -
 50
50 -
 51
51 -
 52
52 -
 53
53 -
 54
54 -
55
-
56
-
57
-
58
-
59
-
60
-
61
-
62
-
63
-
64
-
65
-
66
-
67
-
68
-
69
-
70
-
71
-
72
-
73
-
74
-
75
-
76
-
77
-
78
-
79
-
80
-
81
-
82
-
83
-
84
-
85
-
86
-
87
-
88
-
89
-
90
-
91
-
92
-
93
-
94
-
95
-
96
-
97
-
98
-
99
-
100
-
101
-
102
 |
 |

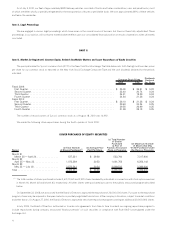
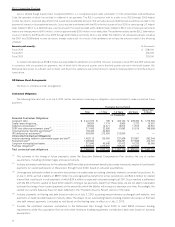
The following table sets forth sales and operating income of each of our reportable segments, the other segment, and intersegment sales,
expressed as a percentage of aggregate segment sales, including intersegment sales, and operating income, respectively. For purposes of this
statistical table, operating income of our segments excludes corporate expenses of $269.6 million in fiscal 2010, $219.3 million in fiscal 2009 and
$196.7 million in fiscal 2008 that are not charged to our segments. This information should be read in conjunction with Note 19, “Business Segment
Information” to the Consolidated Financial Statements in Item 8:
Sales
Segment
Operating
Income Sales
Segment
Operating
Income Sales
Segment
Operating
Income
2010
(53 Weeks) 2009 2008
Broadline ............................................. 79.9% 92.4% 79.4% 93.7% 79.5% 93.0%
SYGMA .............................................. 13.1 2.1 13.1 1.4 12.2 0.4
Other . .............................................. 8.5 5.5 8.8 4.9 9.6 6.6
Intersegment sales . . . ................................... (1.5) — (1.3) — (1.3) —
Total . . .............................................. 100.0% 100.0% 100.0% 100.0% 100.0% 100.0%
Included in corporate expenses, among other items, are:
• Gains and losses recognized to adjust corporate-owned life insurance policies to their cash surrender values;
• Share-based compensation expense;
• Expenses related to the company’s Business Transformation Project; and
• Corporate-level depreciation and amortization expense.
Broadline Segment
The Broadline reportable segment consists of the aggregated results of the United States, Canadian and European Broadline segments.
Broadline operating companies distribute a full line of food products and a wide variety of non-food products to customers. Broadline operations
have significantly higher operating margins than the rest of Sysco’s operations. In fiscal 2010, the Broadline operating results represented
approximately 80% of Sysco’s overall sales and 92% of the aggregate operating income of Sysco’s segments, which excludes corporate expenses
and consolidated adjustments.
There are several factors which contribute to these higher operating results as compared to the SYGMA and Other operating segments. We
have invested substantial amounts in assets, operating methods, technology and management expertise in this segment. The breadth of its sales
force, geographic reach of its distribution area and its purchasing power allow us to leverage this segment’s earnings.
Sales
Sales for fiscal 2010 were 1.7% greater than fiscal 2009. Case volume improvement caused an increase in sales in fiscal 2010 as compared to
fiscal 2009. The changes in the exchange rates used to translate our foreign sales into U.S. dollars positively impacted sales by 1.0% compared to
fiscal 2009. Non-comparable acquisitions contributed 0.6% to the overall sales comparison for fiscal 2010. Product cost deflation, which led to
decreases in selling prices, and a change in customer sales mix partially offset case volume improvement in fiscal 2010. The additional week also
contributed to the sales growth in fiscal 2010.
Sales for fiscal 2009 were 2.0% less than fiscal 2008. Case volume declines attributable to the impact of the negative business environment
caused a decline in sales in fiscal 2009 as compared to fiscal 2008. The changes in the exchange rates used to translate our foreign sales into
U.S. dollars negatively impacted sales by 1.5% compared to fiscal 2008. Non-comparable acquisitions contributed 0.2% to the overall sales
comparison for fiscal 2009. Product cost inflation, which led to increases in selling prices, partially offset case volume declines in fiscal 2009.
Operating Income
The increase in operating income in fiscal 2010 over fiscal 2009 was primarily due to effective management of operations in the current
economic environment by decreasing expenses as compared to the comparable prior year periods. Operating expenses decreased 1.4% in fiscal
2010 as compared to fiscal 2009. The additional week in fiscal 2010 contributed to the gross margin increase, partially offset by a decrease of
approximately $37.4 million in the fuel surcharges charged to customers in fiscal 2010 as compared to fiscal 2009 due to less usage of these
surcharges in fiscal 2010. Expense performance for fiscal 2010 was primarily due to reduced fuel cost and lower provision for losses on receivables
and operating efficiencies, such as reduced pay — related expense due to reduced headcount. Fuel costs were $50.6 million lower in fiscal 2010 than
in the prior year. Partially offsetting these expense declines were increases in expenses related to the additional week in fiscal 2010.
The increase in operating income in fiscal 2009 over fiscal 2008 was primarily due to effective management of operations in the weak
economic environment. Effective management was also evidenced by margins declining at a lower rate than our sales decline and by decreasing
expenses as compared to the comparable prior year periods. Gross margin dollars decreased 1.7% while operating expenses decreased 3.2% in fiscal
2009 as compared to fiscal 2008. Offsetting the gross margin decline was an increase in fuel surcharges of $9.0 million as a result of increased
usage of fuel surcharges in the first half of fiscal 2009 due to sustained increased market diesel prices. Expense performance for fiscal 2009 was
aided by lower payroll-related expenses related to reduced headcount and lower incentive compensation and operating efficiencies, partially offset
by an increase in the provision for losses on receivables and increased fuel cost. Fuel costs were $28.8 million higher in fiscal 2009 over fiscal 2008.
20