Sysco 2010 Annual Report Download - page 8
Download and view the complete annual report
Please find page 8 of the 2010 Sysco annual report below. You can navigate through the pages in the report by either clicking on the pages listed below, or by using the keyword search tool below to find specific information within the annual report.-
 1
1 -
 2
2 -
 3
3 -
 4
4 -
 5
5 -
 6
6 -
 7
7 -
 8
8 -
 9
9 -
 10
10 -
 11
11 -
 12
12 -
 13
13 -
 14
14 -
 15
15 -
 16
16 -
 17
17 -
 18
18 -
 19
19 -
20
-
21
-
22
-
23
-
24
-
25
-
26
-
27
-
28
-
29
-
30
-
31
-
32
-
33
-
34
-
35
-
36
-
37
-
38
-
39
-
40
-
41
-
42
-
43
-
44
-
45
-
46
-
47
-
48
-
49
-
50
-
51
-
52
-
53
-
54
-
55
-
56
-
57
-
58
-
59
-
60
-
61
-
62
-
63
-
64
-
65
-
66
-
67
-
68
-
69
-
70
-
71
-
72
-
73
-
74
-
75
-
76
-
77
-
78
-
79
-
80
-
81
-
82
-
83
-
84
-
85
-
86
-
87
-
88
-
89
-
90
-
91
-
92
-
93
-
94
-
95
-
96
-
97
-
98
-
99
-
100
-
101
-
102
 |
 |

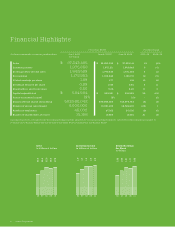
Fiscal Year Ended Percent Change
(Dollars in thousands, except for per share data) July 3, 2010 June 27, 2009 June 28, 2008 2010–09 2009–08
(53 weeks)
Sales $ 37,243,495 $ 36,853,330 $ 37,522,111 1% (2)%
Operating income 1,975,868 1,872,211 1,879,949 6 (0)
Earnings before income taxes 1,849,589 1,770,834 1,791,338 4 (1)
Net earnings 1,179,983 1,055,948 1,106,151 12 (5)
Diluted earnings per share 1.99 1.77 1.81 12 (2)
Dividends declared per share 0.99 0.94 0.85 5 11
Shareholders’ equity per share 6.50 5.85 5.68 11 3
Capital expenditures $ 594,604 $ 464,561 $ 515,963 28 (10)
Return on invested capital 19% 19% 21% – (2)
Diluted average shares outstanding 593,590,042 596,069,204 610,970,783 (0) (2)
Number of shares repurchased 6,000,000 16,951,200 16,769,900 (65) 1
Number of employees 46,000 47,000 50,000 (2) (6)
Number of shareholders of record 15,158 12,564 13,015 21 (3)
Our financial results are impacted by accounting changes and the adoption of various accounting standards. Information regarding these changes is
available in our Annual Report on Form 10-K for fiscal 2010, which is included in this Annual Report.
Financial Highlights
6 Sysco Corporation
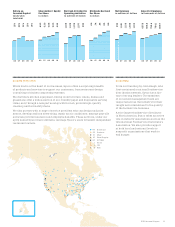
Sales
in billions of dollars
06
32.6
07
35.0
08
37.5
09
36.9
10
37.2
Operating Income
in billions of dollars
06
1.5
07
1.7
08
1.9
09
1.9
10
2.0
Diluted Earnings
Per Share
in dollars
06
1.36
07
1.60
08
1.81
09
1.77
10
1.99