Sysco 2010 Annual Report Download - page 41
Download and view the complete annual report
Please find page 41 of the 2010 Sysco annual report below. You can navigate through the pages in the report by either clicking on the pages listed below, or by using the keyword search tool below to find specific information within the annual report.-
 1
1 -
2
-
3
-
4
-
5
-
6
-
7
-
8
-
9
-
10
-
11
-
12
-
13
-
14
-
15
-
16
-
17
-
18
-
19
-
20
-
21
-
22
-
23
-
24
-
25
-
26
-
27
-
28
-
29
-
30
-
 31
31 -
 32
32 -
 33
33 -
 34
34 -
 35
35 -
 36
36 -
 37
37 -
 38
38 -
 39
39 -
 40
40 -
 41
41 -
 42
42 -
 43
43 -
 44
44 -
 45
45 -
 46
46 -
 47
47 -
 48
48 -
 49
49 -
 50
50 -
 51
51 -
52
-
53
-
54
-
55
-
56
-
57
-
58
-
59
-
60
-
61
-
62
-
63
-
64
-
65
-
66
-
67
-
68
-
69
-
70
-
71
-
72
-
73
-
74
-
75
-
76
-
77
-
78
-
79
-
80
-
81
-
82
-
83
-
84
-
85
-
86
-
87
-
88
-
89
-
90
-
91
-
92
-
93
-
94
-
95
-
96
-
97
-
98
-
99
-
100
-
101
-
102
 |
 |
26.1% in fiscal 2010 over fiscal 2009 compared to an increase of 18.6% in fiscal 2009 over fiscal 2008. Sysco’s activities to mitigate fuel costs
include reducing miles driven by our trucks through improved routing techniques, improving fleet utilization by adjusting idling time and maximum
speeds and using fuel surcharges.
We periodically enter into forward purchase commitments for a portion of our projected monthly diesel fuel requirements. In fiscal 2010, the
forward purchase commitments resulted in an estimated $1.5 million of additional fuel costs as the fixed price contracts were higher than market
prices for the contracted volumes for a portion of the fiscal year. In fiscal 2009, the forward purchase commitments resulted in an estimated
$68.0 million of additional fuel costs as the fixed price contracts were higher than market prices for the contracted volumes. In fiscal 2008, the
forward purchase commitments resulted in an estimated $21.0 million of avoided fuel costs as the fixed price contracts were generally lower than
market prices for the contracted volumes.
As of July 3, 2010, we had forward diesel fuel commitments totaling approximately $93 million through September 2011. These contracts will
lock in the price of approximately 30% to 35% of our fuel purchase needs for the contracted periods at prices slightly lower than the current market
price for diesel. Assuming that fuel prices do not rise significantly over recent levels during fiscal 2011, fuel costs exclusive of any amounts recovered
through fuel surcharges, are expected to increase by approximately $10 million to $20 million as compared to fiscal 2010. Our estimate is based
upon current, published quarterly market price projections for diesel, the cost committed to in our forward fuel purchase agreements currently in
place for fiscal 2011 and estimates of fuel consumption. Actual fuel costs could vary from our estimates if any of these assumptions change, in
particular if future fuel prices vary significantly from our current estimates. We continue to evaluate all opportunities to offset potential increases in
fuel expense, including the use of fuel surcharges and overall expense management.
We adjust the carrying values of our corporate-owned life insurance policies to their cash surrender values on an ongoing basis. The cash
surrender values of these policies are largely based on the values of underlying investments, which include publicly traded securities. As a result, the
cash surrender values of these policies will fluctuate with changes in the market value of such securities. The changes in the financial markets
resulted in gains for these policies of $21.6 million in fiscal 2010, compared to losses for these policies of $43.8 million in fiscal 2009 and $8.7 million
in fiscal 2008. The performance of the financial markets will continue to influence the cash surrender values of our corporate-owned life insurance
policies, which could cause volatility in operating income, net earnings and earnings per share.
The provision for losses on receivables included within operating expenses decreased by $39.7 million in fiscal 2010 from fiscal 2009 and
increased by $42.5 million in fiscal 2009 over fiscal 2008. The decrease in our provision for losses on receivables in fiscal 2010 reflects fewer
customer accounts exceeding our threshold for write-off in fiscal 2010 as compared to fiscal 2009. In fiscal 2009, the economic conditions and
related decrease in consumer demand combined with tightening credit markets impacted the liquidity of some of our customers, resulting in an
increase in delinquent payments on accounts receivable. The increase in our provision for losses on receivables in fiscal 2009 was related to
customer accounts across our customer base without concentration in any specific location. Customer accounts written off, net of recoveries, were
$34.3 million, or 0.10% of sales, $71.9 million, or 0.20% of sales, and $32.4 million, or 0.09% of sales, for fiscal 2010, 2009 and 2008, respectively.
Our provision for losses on receivables will fluctuate with general market conditions, as well as the circumstances of our customers.
Pay-related expenses, excluding labor costs associated with our Business Transformation Project, increased by $43.9 million in fiscal 2010 from
fiscal 2009 and decreased by $199.2 million in fiscal 2009 from fiscal 2008. The fiscal 2010 increase was primarily due to increased provisions for
management incentive accruals and cost associated with the additional week included in fiscal 2010. Partially offsetting these increases were lower
pay-related expenses due to reduced headcount. The fiscal 2009 decline was due to a combination of reduced headcount and lower incentive
compensation.The criteria for paying annual bonuses to our corporate officers and certain portions of operating company management bonuses are
tied to overall company performance. In fiscal 2010, the overall company performance criteria for payment of such bonuses was met; therefore, the
provision for current management incentive bonuses was higher in fiscal 2010 than in fiscal 2009 when the company assessed it did not meet the
criteria for paying certain annual bonuses. In fiscal 2009, the overall company performance criteria for payment of such bonuses were not met;
therefore, corporate executive officers did not receive bonuses for fiscal 2009 and operating company management bonuses were at lower levels for
fiscal 2009 as compared to fiscal 2008. Headcount declines occurred due to both productivity improvements and workforce reductions
commensurate with lower sales. Headcount was 2.2% lower at the end of fiscal 2010 as compared to fiscal 2009 and 5.8% lower at the end
of fiscal 2009 as compared to fiscal 2008.
Net company-sponsored pension costs in fiscal 2010 were $37.4 million higher than in fiscal 2009. Net company-sponsored pension costs
were $22.9 million higher in fiscal 2009 than in fiscal 2008. The increase in fiscal 2010 was due primarily to lower returns on assets of Sysco’s
company-sponsored qualified pension plan (Retirement Plan) during fiscal 2009, partially offset by an increase in the discount rates used to
calculate our projected benefit obligation and related pension expense for fiscal 2010.The increase in fiscal 2009 was due primarily to lower returns
on assets of Sysco’s Retirement Plan during fiscal 2008 and the merging of participants from a multi-employer pension plan to the Retirement Plan,
partially offset by a decrease in expense due to an increase in the discount rates used to calculate the plan’s liabilities and amendments to our
Supplemental Executive Retirement Plan (SERP). Net company-sponsored pension costs in fiscal 2011 are expected to increase by approximately
$60.3 million over fiscal 2010 due primarily to a decrease in discount rates used to calculate our projected benefit obligation and related pension
expense, partially offset by reduced amortization of expense from actuarial gains from higher returns on assets of Sysco’s Retirement Plan during
fiscal 2010.
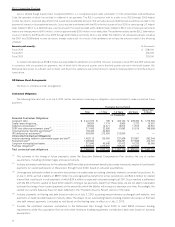
Expenses related to our Business Transformation Project, inclusive of pay-related expense, increased by $41.6 million in fiscal 2010 from fiscal
2009. Our Business Transformation Project began in January 2009; therefore, fiscal 2009 only included six months of activity. Sysco redeployed
employees to work on the Business Transformation Project and did not backfill all of these positions; therefore, not all expenses related to this project
17