Sysco 2010 Annual Report Download - page 20
Download and view the complete annual report
Please find page 20 of the 2010 Sysco annual report below. You can navigate through the pages in the report by either clicking on the pages listed below, or by using the keyword search tool below to find specific information within the annual report.-
 1
1 -
2
-
3
-
4
-
5
-
6
-
7
-
8
-
9
-
 10
10 -
 11
11 -
 12
12 -
 13
13 -
 14
14 -
 15
15 -
 16
16 -
 17
17 -
 18
18 -
 19
19 -
 20
20 -
 21
21 -
 22
22 -
 23
23 -
 24
24 -
 25
25 -
 26
26 -
 27
27 -
 28
28 -
 29
29 -
 30
30 -
31
-
32
-
33
-
34
-
35
-
36
-
37
-
38
-
39
-
40
-
41
-
42
-
43
-
44
-
45
-
46
-
47
-
48
-
49
-
50
-
51
-
52
-
53
-
54
-
55
-
56
-
57
-
58
-
59
-
60
-
61
-
62
-
63
-
64
-
65
-
66
-
67
-
68
-
69
-
70
-
71
-
72
-
73
-
74
-
75
-
76
-
77
-
78
-
79
-
80
-
81
-
82
-
83
-
84
-
85
-
86
-
87
-
88
-
89
-
90
-
91
-
92
-
93
-
94
-
95
-
96
-
97
-
98
-
99
-
100
-
101
-
102
 |
 |

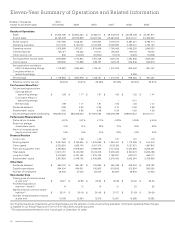
2010
(53 weeks) 2009 2008 2007 2006 2005
Results of Operations
Sales $ 37,243,495 $ 36,853,330 $ 37,522,111 $ 35,042,075 $ 32,628,438 $ 30,281,914
Cost of sales 30,136,009 29,816,999 30,327,254 28,284,603 26,337,107 24,498,200
Gross margins 7,107,486 7,036,331 7,194,857 6,757,472 6,291,331 5,783,714
Operating expenses 5,131,618 5,164,120 5,314,908 5,048,990 4,796,301 4,194,184
Operating income 1,975,868 1,872,211 1,879,949 1,708,482 1,495,030 1,589,530
Interest expense 125,477 116,322 111,541 105,002 109,100 75,000
Other income, net 802 (14,945) (22,930) (17,735) (9,016) (10,906)
Earnings before income taxes 1,849,589 1,770,834 1,791,338 1,621,215 1,394,946 1,525,436
Income taxes 669,606 714,886 685,187 620,139 548,906 563,979
Earnings before cumulative
effect of accounting change 1,179,983 1,055,948 1,106,151 1,001,076 846,040 961,457
Cumulative effect of
accounting change – – – – 9,285 –
Net earnings $ 1,179,983 $ 1,055,948 $ 1,106,151 $ 1,001,076 $ 855,325 $ 961,457
Effective income tax rate 36.20% 40.37% 38.25% 38.25% 39.35% 36.97%
Per Common Share Data(1)
Diluted earnings per share:
Earnings before
accounting change $ 1.99 $ 1.77 $ 1.81 $ 1.60 $ 1.35 $ 1.47
Cumulative effect of
accounting change – – – – 0.01 –
Net earnings 1.99 1.77 1.81 1.60 1.36 1.47
Dividends declared 0.99 0.94 0.85 0.74 0.66 0.58
Shareholders’ equity 6.50 5.85 5.68 5.36 4.93 4.39
Diluted average shares outstanding 593,590,042 596,069,204 610,970,783 626,366,798 628,800,647 653,157,117
Performance Measurements
Pretax return on sales 4.97% 4.81% 4.77% 4.63% 4.28% 5.04%
Return on average
shareholders’ equity 31% 31% 33% 31% 30% 35%
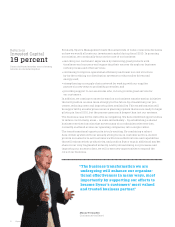
Return on invested capital
(equity plus total debt) 19% 19% 21% 20% 19% 23%
Financial Position
Current ratio 1.69 1.69 1.49 1.37 1.37 1.16
Working capital $ 2,067,060 $ 2,120,525 $ 1,675,690 $ 1,260,457 $ 1,173,290 $ 544,216
Other assets 2,033,620 1,966,740 2,017,470 2,122,152 2,127,431 1,997,815
Plant and equipment (net) 3,203,823 2,979,200 2,889,790 2,721,233 2,464,900 2,268,301
Total assets 10,313,701 10,148,186 10,010,615 9,475,365 8,937,470 8,223,488
Long-term debt 2,472,662 2,467,486 1,975,435 1,758,227 1,627,127 956,177
Shareholders’ equity 3,827,526 3,449,702 3,408,986 3,278,400 3,052,284 2,758,839
Other Data
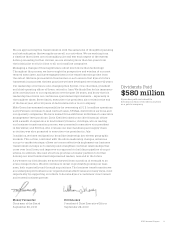
Dividends declared $ 585,734 $ 557,487 $ 513,593 $ 456,438 $ 408,264 $ 368,792
Capital expenditures 594,604 464,561 515,963 603,242 513,934 390,026
Number of employees 46,000 47,000 50,000 50,900 49,600 47,500
Shareholder Data
Closing price of common share
at year end(1) $ 28.27 $ 22.98 $ 28.22 $ 32.99 $ 30.56 $ 36.25
Price/earnings ratio at
year end – diluted(1) 14 13 16 21 23 25
Market price per common share –
high/low(1) $ 32–21 $ 35–19 $ 36–26 $ 37–27 $ 37–29 $ 38–29
Number of shareholders of record
at year end 15,158 12,564 13,015 13,557 14,282 15,083
Our financial results are impacted by accounting changes and the adoption of various accounting standards. Information regarding these changes
is available in our Annual Reports on Form 10-K for fiscal 2010 and previous years.
(1)The data presented reflects the 2-for-1 stock split on December 15, 2000.
(Dollars in thousands
except for per share data)
Eleven-Year Summary of Operations and Related Information
18 Sysco Corporation