Target 2014 Annual Report Download
Download and view the complete annual report
Please find the complete 2014 Target annual report below. You can navigate through the pages in the report by either clicking on the pages listed below, or by using the keyword search tool below to find specific information within the annual report.-
 1
1 -
 2
2 -
 3
3 -
 4
4 -
 5
5 -
 6
6 -
 7
7 -
 8
8 -
 9
9 -
 10
10 -
 11
11 -
 12
12 -
13
-
14
-
15
-
16
-
17
-
18
-
19
-
20
-
21
-
22
-
23
-
24
-
25
-
26
-
27
-
28
-
29
-
30
-
31
-
32
-
33
-
34
-
35
-
36
-
37
-
38
-
39
-
40
-
41
-
42
-
43
-
44
-
45
-
46
-
47
-
48
-
49
-
50
-
51
-
52
-
53
-
54
-
55
-
56
-
57
-
58
-
59
-
60
-
61
-
62
-
63
-
64
-
65
-
66
-
67
-
68
-
69
-
70
-
71
-
72
-
73
-
74
-
75
-
76
-
77
-
78
-
79
-
80
-
81
-
82
 |
 |

Visit our online Annual Report
at Target.com/annualreport.
1000 Nicollet Mall, Minneapolis, MN 55403 612.304.6073
91872_Cvr.indd 1 4/16/15 5:15 PM
Target 2014 Annual Report
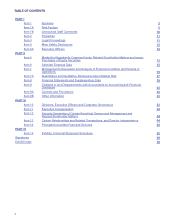
Table of contents
-
Page 1
Target 2014 Annual Report -
Page 2
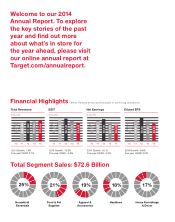
... find out more about what's in store for the year ahead, please visit our online annual report at Target.com/annualreport. Financial Highlights Total Revenues IN MILLIONS (Note: Reflects amounts attributable to continuing operations.) EBIT IN MILLIONS Net Earnings IN MILLIONS Diluted EPS $65... -
Page 3
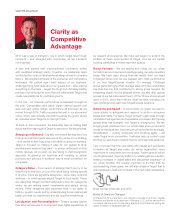
... as well, in our stores and online, which was critically important because the guest, above all, indicates when Target is on the right track. To build on this momentum, the leadership team is holding itself accountable for aligning all of Target to execute on five key priorities: Shopping on Demand... -
Page 4
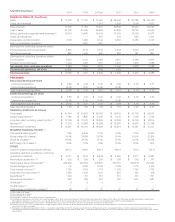
... per square foot which is calculated using rolling 13 month average square feet and a rolling four quarters of average revenue. In 2012, revenue per square foot was calculated excluding the 53rd week in order to provide a more useful comparison to other years. Using total reported revenues for 2012... -
Page 5
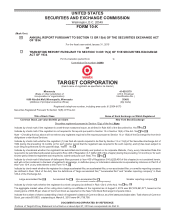
...the closing price of $59.85 per share of Common Stock as reported on the New York Stock Exchange Composite Index. Indicate the number of shares outstanding of each of registrant's classes of Common Stock, as of the latest practicable date. Total shares of Common Stock, par value $0.0833, outstanding... -
Page 6
... Supplementary Data Changes in and Disagreements with Accountants on Accounting and Financial Disclosure Controls and Procedures Other Information Directors, Executive Officers and Corporate Governance Executive Compensation Security Ownership of Certain Beneficial Owners and Management and Related... -
Page 7
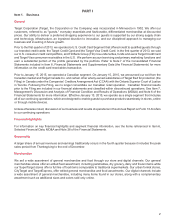
... are designed to enable guests to purchase products seamlessly in stores, online or through mobile devices. Unless otherwise noted, discussion of our business and results of operations in this Annual Report on Form 10-K refers to our continuing operations. Financial Highlights For information on key... -
Page 8
... range of company-paid benefits to our team members. Eligibility for, and the level of, these benefits varies depending on team members' full-time or part-time status, compensation level, date of hire and/or length of service. These company-paid benefits include a pension plan, 401 (k) plan, medical... -
Page 9
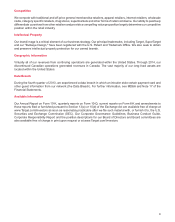
...operations generated revenues in Canada. The vast majority of our long-lived assets are located within the United States. Data Breach During the fourth quarter of 2013, we experienced a data breach in which an intruder stole certain payment card and other guest information from our network (the Data... -
Page 10
...; and encouraging our guests to shop with confidence with our price-match policy. Failure to effectively execute in these efforts, actions by our competitors in response to these efforts, or failures of our vendors to manage their own channels, content and technology systems could hurt our ability... -
Page 11
... guests may result in lost sales, spoilage, and increased inventory markdowns, which would lead to a deterioration in our results of operations by hurting our sales, gross margins, and profitability. Technology Investments and Infrastructure Risks If our capital investments in technology, new stores... -
Page 12
...impact on our results of operations. The Data Breach we experienced was significant, went undetected for several weeks, and involved the theft of certain payment card and guest information through unauthorized access to our network. We experienced weaker than expected sales immediately following the... -
Page 13
...increased commodity, supply chain and fulfillment costs, or changes in our relationships with our vendors could adversely affect our gross margins, expenses and results of operations. We are dependent on our vendors to supply merchandise to our distribution centers, stores and our guests in a timely... -
Page 14
..., guest service levels and support functions could suffer. Those factors, together with increasing wage and benefit costs, could adversely affect our results of operations. As of March 13, 2015, none of our team members were working under collective bargaining agreements. We are periodically subject... -
Page 15
...-functioning financial system to fund our operations and capital investments. In particular, we have historically relied on the public debt markets to fund portions of our capital investments and the commercial paper market and bank credit facilities to fund seasonal needs for working capital. Our... -
Page 16
...Stores 1,536 99 155 1,790 The 38 distribution centers have a total of 50,185 thousand square feet. We own our corporate headquarters buildings located in and around Minneapolis, Minnesota, and we lease and own additional office space in Minneapolis and elsewhere in the United States. We also lease... -
Page 17
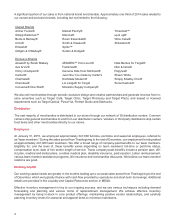
...litigation and government inquiries related to the Data Breach, see MD&A and Note 17 of the Financial Statements. Item 4. Mine Safety Disclosures Not applicable. Item 4A. Executive Officers Executive officers are elected by, and serve at the pleasure of, the Board of Directors. There are no family... -
Page 18
...cash investment of $3.1 billion ($62.85 average price per share). The table below presents our purchases of Target common stock during the three months ended January 31, 2015, as defined in Rule 10b-18(a)(3) under the Exchange Act. Average Total Number Price Paid of Shares Purchased (a)(b) per Share... -
Page 19
... graph above compares the cumulative total shareholder return on our common stock for the last five fiscal years with (i) the cumulative total return on the S&P 500 Index, (ii) the peer group used in previous filings consisting of 14 online, general merchandise, department store, food and specialty... -
Page 20
... Financial Statements. Consisted of 53 weeks. For 2014 and 2013, total revenues include sales generated by our retail operations. For 2012 and prior, total revenues include sales generated by our retail operations and credit card revenues. Item 7. Management's Discussion and Analysis of Financial... -
Page 21
... page 21. (a) Consisted of 53 weeks. Canada Exit On January 14, 2015, following a comprehensive assessment of Canadian operations, our Board of Directors approved a plan to discontinue operating stores in Canada. As a result of this decision, on January 15, 2015, Target Canada Co. and certain other... -
Page 22
...discretely managed. Our segment operations are designed to enable guests to purchase products seamlessly in stores, online or through mobile devices. See Note 28 of our Financial Statements for a reconciliation of our segment results to earnings before income taxes. (a) Consisted of 53 weeks. (b) SG... -
Page 23
... gift card breakage. Refer to Note 2 of the Financial Statements for a definition of gift card breakage. The increase in 2014 sales reflects a 1.3 percent increase in comparable sales and the contribution from new stores. The sales decline in 2013 reflected the impact of an additional week in 2012... -
Page 24
... in 2012. The 2014 decrease is primarily due to promotional activity. The 2013 increase was primarily the result of a change in vendor contracts regarding payments received in support of marketing programs resulting in more vendor consideration being recognized as a reduction of our cost of sales... -
Page 25
... million in 2014 and 2013, respectively. A tax rate reconciliation is provided in Note 21 to our Consolidated Financial Statements. Our effective income tax rate from continuing operations increased to 34.6 percent in 2013, from 34.4 percent in 2012, driven by a lower year-over-year benefit from the... -
Page 26
... $725 million of debt at a market value of $1 billion, pay current debt maturities, invest in the business and pay dividends. Year-end inventory levels increased from $8,278 million in 2013 to $8,790 million in 2014. Accounts payable increased by $424 million, or 5.8 percent over the same period. 21 -
Page 27
...share) in 2013, a per share increase of 19.6 percent over 2012. We have paid dividends every quarter since our 1967 initial public offering, and it is our intent to continue to do so in the future. Short-term and Long-term Financing Our financing strategy is to ensure liquidity and access to capital... -
Page 28
... a leading omnichannel retailer through investments in technology and supply chain, elevating signature categories and opening new stores, including urban formats. Capital expenditures related to our discontinued Canadian operations were $228 million, $1,567 million and $932 million for 2014, 2013... -
Page 29
... minimum lease payments for stores that are expected to open in 2015 or later for capital and operating leases, respectively. Capital lease obligations include interest. See Note 20 of the Financial Statements for further information. Deferred compensation obligations include commitments related to... -
Page 30
... of the Canada Subsidiaries to estimated liabilities at the time of the Filing. We estimated the fair value of the major asset classes using estimated selling price less cost to sell, the income approach based on estimated market rents and capitalization rates, and discounted cash flow analysis of... -
Page 31
... of the Financial Statements. Pension and postretirement health care accounting: We maintain a funded qualified, defined benefit pension plan, as well as several smaller and unfunded nonqualified plans and a postretirement health care plan for certain current and retired team members. The costs for... -
Page 32
... impact of new accounting pronouncements, our intentions regarding future dividends, contributions and payments related to our pension and postretirement health care plans, the expected returns on pension plan assets, the expected timing and recognition of compensation expenses, the effects of... -
Page 33
..., we are exposed to market return fluctuations on our qualified defined benefit pension plans. The value of our pension liabilities is inversely related to changes in interest rates. A 0.5 percentage point decrease to the weighted average discount rate would increase annual expense by $29 million... -
Page 34
... Chairman and Chief Executive Officer March 13, 2015 John J. Mulligan Executive Vice President and Chief Financial Officer _____ Report of Independent Registered Public Accounting Firm on Consolidated Financial Statements The Board of Directors and Shareholders Target Corporation We have audited... -
Page 35
... Chairman and Chief Executive Officer March 13, 2015 John J. Mulligan Executive Vice President and Chief Financial Officer _____ Report of Independent Registered Public Accounting Firm on Internal Control over Financial Reporting The Board of Directors and Shareholders Target Corporation We have... -
Page 36
... per share data) Sales Credit card revenues Total revenues Cost of sales Selling, general and administrative expenses Credit card expenses Depreciation and amortization Gain on receivables transaction Earnings from continuing operations before interest expense and income taxes Net interest expense... -
Page 37
...Currency translation adjustment and cash flow hedges, net of provision for taxes of $2, $11 and $8 Other comprehensive income/(loss) Comprehensive (loss)/income $ See accompanying Notes to Consolidated Financial Statements. 2014 (1,636) $ 2013 1,971 $ 2012 2,999 (139) 431 292 (1,344) $ 110 (425... -
Page 38
... discontinued operations Total current liabilities Long-term debt and other borrowings Deferred income taxes Noncurrent liabilities of discontinued operations Other noncurrent liabilities Total noncurrent liabilities Shareholders' investment Common stock Additional paid-in capital Retained earnings... -
Page 39
... paper, net Reductions of short-term debt Additions to long-term debt Reductions of long-term debt Dividends paid Repurchase of stock Stock option exercises and related tax benefit Other Cash required for financing activities Effect of exchange rate changes on cash and cash equivalents Net increase... -
Page 40
... awards February 2, 2013 Net earnings Other comprehensive loss Dividends declared Repurchase of stock Stock options and awards February 1, 2014 Net loss Other comprehensive income Dividends declared Repurchase of stock Stock options and awards January 31, 2015 $ $ $ $ $ $ $ $ Total 15,821... -
Page 41
..., 2015, Target Corporation (Target, the Corporation, or the Company) operates as a single segment that includes all of our continuing operations, which are designed to enable guests to purchase products seamlessly in stores, online or through mobile devices. Consolidation The consolidated financial... -
Page 42
...our guests Payment term cash discounts Distribution center costs, including compensation and benefits costs Import costs 4. Consideration Received from Vendors We receive consideration for a variety of vendor-sponsored programs, such as volume rebates, markdown allowances, promotions and advertising... -
Page 43
... distribution to its creditors, the fair value of Target's equity investment approximates zero. Target Corporation Amounts Receivable from Canada Subsidiaries Prior to deconsolidation, Target Corporation made loans to the Canada Subsidiaries for the purpose of funding its operations and had accounts... -
Page 44
... Estimated selling price less costs to sell Level 3 Income approach based on estimated market rents and cap rates Level 3 Discounted cash flow analysis of the differential between estimated market rent and contractual rent payments Level 3 Asset Inventory Owned property Leased property, including... -
Page 45
... Visa receivables. TD controls risk management policies and oversees regulatory compliance, and we perform account servicing and primary marketing functions. We earn a substantial portion of the profits generated by the Target Credit Card and Target Visa portfolios. Income from the TD profit-sharing... -
Page 46
... credit card agreement. When accounts were written off, uncollected finance charges and late fees were recorded as a reduction of credit card revenues. Target retail sales charged on our credit cards totaled $5,807 million in 2012. 8. Fair Value Measurements Fair value measurements are reported in... -
Page 47
...distribution center operating costs, including compensation and benefits, are expensed in the period incurred. Inventory is also reduced for estimated losses related to shrink and markdowns. The LIFO provision is calculated based on inventory levels, markup rates and internally measured retail price... -
Page 48
... purchase and sale of this inventory. Sales made under these arrangements totaled $2,040 million, $1,833 million and $1,800 million in 2014, 2013 and 2012, respectively. 11. Other Current Assets Other Current Assets (millions) Pharmacy, income tax and other receivables Vendor income receivable... -
Page 49
... investments (a) Interest rate swaps (b) Other Total (a) $ $ January 31, 2015 302 $ 322 65 228 917 $ February 1, 2014 331 305 62 409 1,107 (b) Company-owned life insurance policies on approximately 4,000 team members who have been designated highly compensated under the Internal Revenue... -
Page 50
... payment card data from up to approximately 40 million credit and debit card accounts of guests who shopped at our U.S. stores between November 27 and December 17, 2013. In addition, the intruder stole certain guest information, including names, mailing addresses, phone numbers or email addresses... -
Page 51
... Canada, and other claims have been or may be asserted against us on behalf of guests, payment card issuing banks, shareholders or others seeking damages or other related relief allegedly arising out of the Data Breach. State and federal agencies, including State Attorneys General, the Federal Trade... -
Page 52
.../license commitments and service contracts, were $2,411 million and $1,285 million at January 31, 2015 and February 1, 2014, respectively. These purchase obligations are primarily due within three years and recorded as liabilities when inventory is received. We issue inventory purchase orders, which... -
Page 53
... in net interest expense in our Consolidated Statements of Operations. We periodically obtain short-term financing under our commercial paper program, a form of notes payable. Commercial Paper (dollars in millions) Maximum daily amount outstanding during the year Average amount outstanding during... -
Page 54
... Total rent expense $ $ 2014 195 $ (9) 186 $ 2013 212 $ (8) 204 $ 2012 216 (9) 207 Total capital lease interest expense was $38 million, $39 million and $31 million in 2014, 2013 and 2012, respectively, and is included within net interest expense on the Consolidated Statements of Operations... -
Page 55
... centers opening in 2015. (c) Calculated using the interest rate at inception for each lease. (d) Includes the current portion of $63 million. 21. Income Taxes Earnings from continuing operations before income taxes were $3,653 million, $4,121 million and $5,056 million during 2014, 2013 and 2012... -
Page 56
... would be payable if such earnings were repatriated. We file a U.S. federal income tax return and income tax returns in various states and foreign jurisdictions. The U.S. Internal Revenue Service has completed exams on the U.S. federal income tax returns for years 2010 and prior. With few exceptions... -
Page 57
... Board of Directors in January 2012. No shares were repurchased through open market transactions since the first half of 2013. Share Repurchases (millions, except per share data) Total number of shares purchased (a) Average price paid per share Total investment (a) $ $ 2014 0.8 54.07 $ 41 $ 2013... -
Page 58
... domestic market share change, return on invested capital and EPS growth. The fair value of performance share units is calculated based on the stock price on the date of grant. The weighted average grant date fair value for performance share units was $73.12, $57.22 and $58.61 in 2014, 2013 and 2012... -
Page 59
... over a one-year period and are settled in shares of Target common stock upon departure from the Board. The fair value for restricted stock is calculated based on the stock price on the date of grant, incorporating an analysis of the total shareholder return performance measure where applicable. The... -
Page 60
...Stock (millions, except per share data) February 1, 2014 January 31, 2015 Plan Expenses (millions) 401(k) plan matching contributions expense Nonqualified deferred compensation plans Benefits expense (a) Related investment income (b) Nonqualified plan net expense (a) (b) Contractual Number of Price... -
Page 61
... return on plan assets Employer contributions Participant contributions Benefits paid Fair value of plan assets at end of period Benefit obligation at end of period Funded/(underfunded) status $ Pension Benefits Postretirement Qualified Plans Nonqualified Plans Health Care Benefits 2014 2013 2014... -
Page 62
...summarizes our net pension and postretirement health care benefits expense for the years 2014, 2013, and 2012: Net Pension and Postretirement Health Care Benefits Expense (millions) Service cost benefits earned during the period Interest cost on projected benefit obligation Expected return on assets... -
Page 63
... Health Care Benefits 2014 2013 2.74% 3.30% n/a n/a Discount rate Average assumed rate of compensation increase Pension Benefits 2014 2013 3.87% 4.77% 3.00 3.00 Net Periodic Benefit Expense Weighted Average Assumptions Discount rate Expected long-term rate of return on plan assets Average... -
Page 64
... investments. Level 3 Reconciliation Balance at Beginning of Period 236 $ 122 221 $ 127 (millions) 2013 Private equity funds $ Other 2014 Private equity funds $ Other (a) Actual Return on Plan Assets (a) Relating to Relating to Assets Still Held Assets Sold at the Reporting During the Date Period... -
Page 65
... of the underlying assets owned by the fund minus applicable costs and liabilities, and then divided by the number of shares outstanding. Valued at the closing price reported on the major market on which the individual securities are traded. Valued using the NAV provided by the administrator of the... -
Page 66
...operations, which are designed to enable guests to purchase products seamlessly in stores, online or through mobile devices. Business Segment Results (millions) Sales Cost of sales Selling, general and administrative expenses (f) Depreciation and amortization Segment profit Data Breach-related costs... -
Page 67
... share of total year revenues and earnings because they include our peak sales period from Thanksgiving through the end of December. We follow the same accounting policies for preparing quarterly and annual financial data. The table below summarizes quarterly results for 2014 and 2013: Quarterly... -
Page 68
... Registered Public Accounting Firm on Internal Control over Financial Reporting, see Item 8, Financial Statements and Supplementary Data. Item 9B. Other Information On March 13, 2015, we entered into an Aircraft Time Sharing Agreement with Brian C. Cornell, our chief executive officer, with... -
Page 69
...of Target's Proxy Statement to be filed on or about April 27, 2015, are incorporated herein by reference: • • Stock Ownership Information-Beneficial Ownership of Directors and Officers Beneficial Ownership of Target's Largest Shareholders Compensation Tables--Equity Compensation Plan Information... -
Page 70
... 2013 Consolidated Statements of Shareholders' Investment for the Years Ended January 31, 2015, February 1, 2014 and February 2, 2013 Notes to Consolidated Financial Statements Report of Independent Registered Public Accounting Firm on Consolidated Financial Statements Financial Statement Schedules... -
Page 71
...Bay Company, Target Corporation and Target Canada Co. (5) Purchase and Sale Agreement dated October 22, 2012 among Target National Bank, Target Receivables LLC, Target Corporation and TD Bank USA, N.A. (6) First Amendment to Purchase and Sale Agreement dated March 13, 2013 among Target National Bank... -
Page 72
... Time Sharing Agreement as of March 13, 2015 among Target Corporation and Brian C. Cornell Statements of Computations of Ratios of Earnings to Fixed Charges List of Subsidiaries Consent of Independent Registered Public Accounting Firm Powers of Attorney Certification of the Chief Executive Officer... -
Page 73
...Target's Form 10-Q Report for the quarter ended October 27, 2012. Incorporated by reference to Exhibit (2)G to Target's Form 8-K Report filed March 13, 2013. Incorporated by reference to Exhibit (3)A to Target's Form 8-K Report filed June 10, 2010. Incorporated by reference to Exhibit (3)B to Target... -
Page 74
... the undersigned, thereunto duly authorized. TARGET CORPORATION By: John J. Mulligan Executive Vice President, Chief Financial Officer and Chief Accounting Officer Dated: March 13, 2015 _____ Pursuant to the requirements of the Securities Exchange Act of 1934, the report has been signed below by... -
Page 75
...Bay Company, Target Corporation and Target Canada Co. Purchase and Sale Agreement dated October 22, 2012 among Target National Bank, Target Receivables LLC, Target Corporation and TD Bank USA, N.A. First Amendment to Purchase and Sale Agreement dated March 13, 2013 among Target National Bank, Target... -
Page 76
... Time Sharing Agreement as of March 13, 2015 among Target Corporation and Brian C. Cornell Statements of Computations of Ratios of Earnings to Fixed Charges List of Subsidiaries Consent of Independent Registered Public Accounting Firm Powers of Attorney Certification of the Chief Executive Officer... -
Page 77
101.CAL 101.DEF 101.LAB 101.PRE XBRL Taxonomy Extension Calculation Linkbase XBRL Taxonomy Extension Definition Linkbase XBRL Taxonomy Extension Label Linkbase XBRL Taxonomy Extension Presentation Linkbase Filed Electronically Filed Electronically Filed Electronically Filed Electronically 72 -
Page 78
... of rental expense Total fixed charges Earnings from continuing operations before income taxes and fixed charges (b) Ratio of earnings to fixed charges (a) January 31, 2015 $3,653 (1) 3,652 619 108 727 $4,379 6.02 Fiscal Year Ended February 1, February 2, January 28, 2014 2013 2012 $4,121 (14... -
Page 79
This page has been left blank intentionally -
Page 80
... at www.target.com/investors. Transfer Agent, Registrar and Dividend Disbursing Agent Wetts Fargo Shareowner Services Trustee, Employee Savings 401(K) and Pension Plans State Street Bank and Trust Company Stock Exchange Listing Trading Symbot: TGT New York Stock Exchange Shareholder Assistance For... -
Page 81
...Financial Planning Analysis and Tax Christina Hennington Senior Vice President, Merchandising, Health and Beauty Cynthia Ho Senior Vice President, Target Sourcing Services Keri Jones Executive Vice President, Global Supply Chain and Merchandise Planning Navneet Kapoor President and Managing Director... -
Page 82
Visit our online Annual Report at Target.com/annualreport. 1000 Nicollet Mall, Minneapolis, MN 55403 612.304.6073