Target 2014 Annual Report Download - page 67
Download and view the complete annual report
Please find page 67 of the 2014 Target annual report below. You can navigate through the pages in the report by either clicking on the pages listed below, or by using the keyword search tool below to find specific information within the annual report.-
 1
1 -
2
-
3
-
4
-
5
-
6
-
7
-
8
-
9
-
10
-
11
-
12
-
13
-
14
-
15
-
16
-
17
-
18
-
19
-
20
-
21
-
22
-
23
-
24
-
25
-
26
-
27
-
28
-
29
-
30
-
31
-
32
-
33
-
34
-
35
-
36
-
37
-
38
-
39
-
40
-
41
-
42
-
43
-
44
-
45
-
46
-
47
-
48
-
49
-
50
-
51
-
52
-
53
-
54
-
55
-
56
-
 57
57 -
 58
58 -
 59
59 -
 60
60 -
 61
61 -
 62
62 -
 63
63 -
 64
64 -
 65
65 -
 66
66 -
 67
67 -
 68
68 -
 69
69 -
 70
70 -
 71
71 -
 72
72 -
 73
73 -
 74
74 -
 75
75 -
 76
76 -
 77
77 -
78
-
79
-
80
-
81
-
82
 |
 |
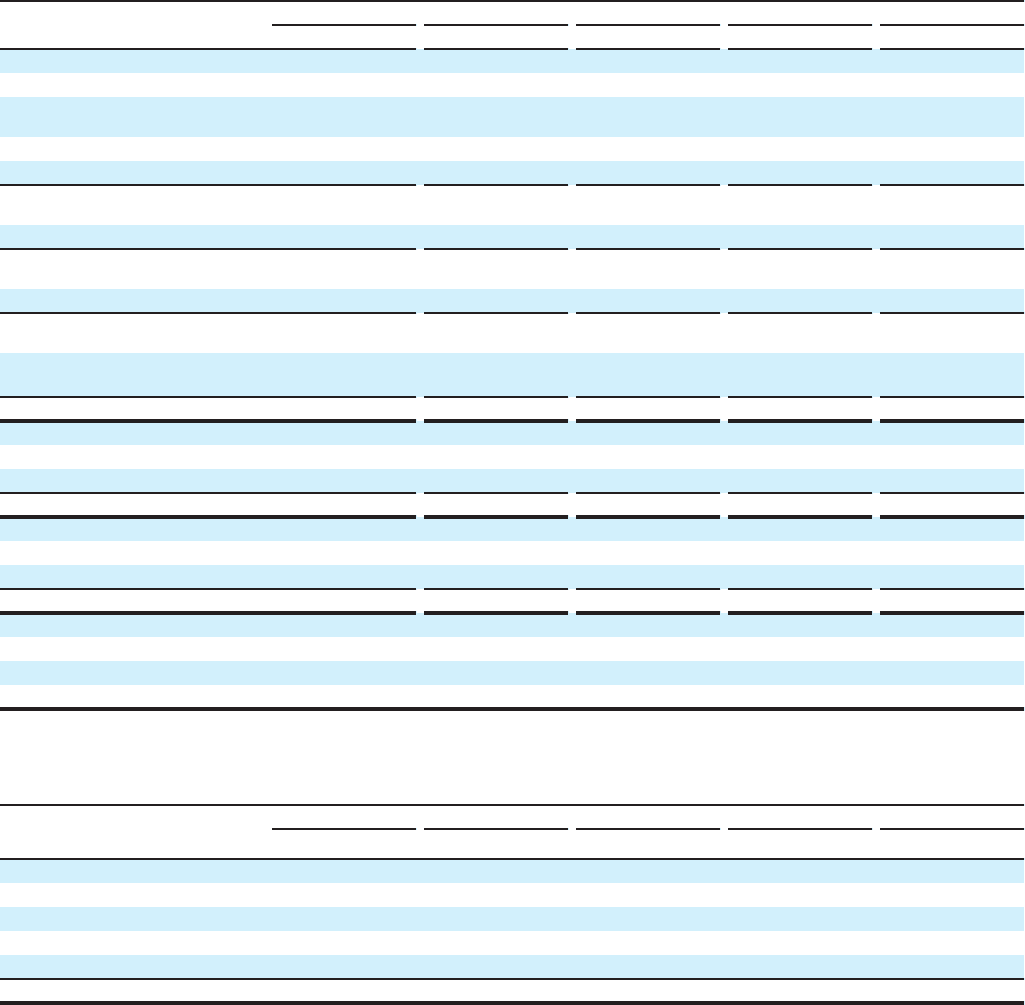
Quarterly Results First Quarter Second Quarter Third Quarter Fourth Quarter Total Year
(millions, except per share data) 2014 2013 2014 2013 2014 2013 2014 2013 2014 2013
Sales $ 16,657 $ 16,620 $ 16,957 $ 16,841 $ 17,254 $ 16,925 $ 21,751 $ 20,893 $ 72,618 $ 71,279
Cost of sales 11,748 11,510 11,798 11,557 12,171 11,849 15,563 15,124 51,278 50,039
Selling, general and administrative
expenses 3,376 3,397 3,599 3,490 3,644 3,632 4,058 3,946 14,676 14,465
Depreciation and amortization 511 491 537 493 535 503 545 508 2,129 1,996
Gain on receivables transaction — (391) —— — — — — — (391)
Earnings before interest expense
and income taxes 1,022 1,613 1,023 1,301 904 941 1,585 1,315 4,535 5,170
Net interest expense 152 610 433 152 146 145 151 142 882 1,049
Earnings from continuing operations
before income taxes 870 1,003 590 1,149 758 796 1,434 1,173 3,653 4,121
Provision for income taxes 299 358 199 403 232 273 474 393 1,204 1,427
Net earnings from continuing
operations 571 645 391 746 526 523 960 780 2,449 2,694
Discontinued operations, net of
tax (153) (147) (157) (134) (174) (182) (3,600) (260) (4,085) (723)
Net earnings/(loss) $ 418 $ 498 $ 234 $ 611 $ 352 $ 341 $ (2,640) $ 520 $ (1,636) $ 1,971
Basic earnings/(loss) per share
Continuing operations $ 0.90 $ 1.00 $ 0.62 $ 1.17 $ 0.83 $ 0.83 $ 1.51 $ 1.23 $ 3.86 $ 4.24
Discontinued operations (0.24) (0.23) (0.25) (0.21) (0.28) (0.29) (5.64) (0.41) (6.44) (1.14)
Net earnings/(loss) per share $ 0.66 $ 0.78 $ 0.37 $ 0.96 $ 0.55 $ 0.54 $ (4.14) $ 0.82 $ (2.58) $ 3.10
Diluted earnings/(loss) per share
Continuing operations $ 0.89 $ 0.99 $ 0.61 $ 1.16 $ 0.82 $ 0.82 $ 1.49 $ 1.22 $ 3.83 $ 4.20
Discontinued operations (0.24) (0.23) (0.25) (0.21) (0.27) (0.29) (5.59) (0.41) (6.38) (1.13)
Net earnings/(loss) per share $ 0.66 $ 0.77 $ 0.37 $ 0.95 $ 0.55 $ 0.54 $ (4.10) $ 0.81 $ (2.56) $ 3.07
Dividends declared per share 0.43 0.36 0.52 0.43 0.52 0.43 0.52 0.43 1.99 1.65
Closing common stock price:
High 62.54 70.67 61.38 73.32 63.93 71.99 77.13 66.89 77.13 73.32
Low 55.07 60.85 55.34 68.29 57.50 62.13 61.12 56.64 55.07 56.64
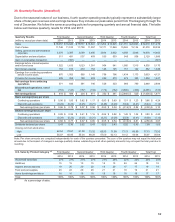
30. Quarterly Results (Unaudited)
Due to the seasonal nature of our business, fourth quarter operating results typically represent a substantially larger
share of total year revenues and earnings because they include our peak sales period from Thanksgiving through the
end of December. We follow the same accounting policies for preparing quarterly and annual financial data. The table
below summarizes quarterly results for 2014 and 2013:
Note: Per share amounts are computed independently for each of the quarters presented. The sum of the quarters may not equal the total year
amount due to the impact of changes in average quarterly shares outstanding and all other quarterly amounts may not equal the total year due to
rounding.
U.S. Sales by Product Category (a) First Quarter
2014 2013
Second Quarter
2014 2013
Third Quarter
2014 2013
Fourth Quarter
2014 2013
Total Year
2014 2013
Household essentials 27% 27% 27% 27% 27% 26% 22% 22% 25% 25%
Hardlines 15 15 15 15 15 15 24 24 18 18
Apparel and accessories 19 20 20 20 19 20 17 17 19 19
Food and pet supplies 23 22 20 20 21 21 19 19 21 21
Home furnishings and décor 16 16 18 18 18 18 18 18 17 17
Total 100% 100% 100% 100% 100% 100% 100% 100% 100% 100%
(a) As a percentage of sales.
62