Target 2014 Annual Report Download - page 57
Download and view the complete annual report
Please find page 57 of the 2014 Target annual report below. You can navigate through the pages in the report by either clicking on the pages listed below, or by using the keyword search tool below to find specific information within the annual report.-
 1
1 -
2
-
3
-
4
-
5
-
6
-
7
-
8
-
9
-
10
-
11
-
12
-
13
-
14
-
15
-
16
-
17
-
18
-
19
-
20
-
21
-
22
-
23
-
24
-
25
-
26
-
27
-
28
-
29
-
30
-
31
-
32
-
33
-
34
-
35
-
36
-
37
-
38
-
39
-
40
-
41
-
42
-
43
-
44
-
45
-
46
-
 47
47 -
 48
48 -
 49
49 -
 50
50 -
 51
51 -
 52
52 -
 53
53 -
 54
54 -
 55
55 -
 56
56 -
 57
57 -
 58
58 -
 59
59 -
 60
60 -
 61
61 -
 62
62 -
 63
63 -
 64
64 -
 65
65 -
 66
66 -
 67
67 -
68
-
69
-
70
-
71
-
72
-
73
-
74
-
75
-
76
-
77
-
78
-
79
-
80
-
81
-
82
 |
 |
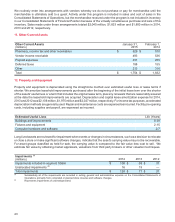
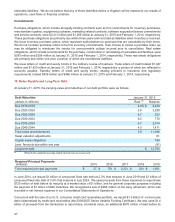
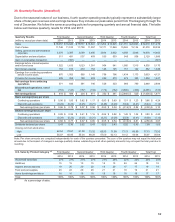
22. Other Noncurrent Liabilities
Other Noncurrent Liabilities
(millions)
January 31,
2015
February 1,
2014
Deferred compensation
Workers' compensation and general liability (a)
$ 507 $
413
491
423
Income tax 128 174
Pension and postretirement health care benefits 151 115
Other 253 268
Total $ 1,452 $ 1,471
(a) See footnote (c) to the Accrued and Other Current Liabilities table in Note 16 for additional detail.
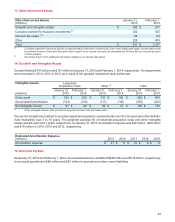
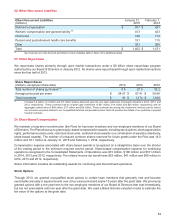
23. Share Repurchase
We repurchase shares primarily through open market transactions under a $5 billion share repurchase program
authorized by our Board of Directors in January 2012. No shares were repurchased through open market transactions
since the first half of 2013.
Share Repurchases
(millions, except per share data) 2014 2013 2012
Total number of shares purchased (a) 0.8 21.9 32.2
Average price paid per share $ 54.07 $ 67.41 $ 58.96
Total investment $ 41 $ 1,474 $ 1,900
(a) Includes 0.8 million, 0.2 million and 0.5 million shares delivered upon the non-cash settlement of prepaid contracts in 2014, 2013, and
2012, respectively. These contracts had an original cash investment of $41 million, $14 million and $25 million, respectively, and an
aggregate market value of $46 million, $17 million and $29 million. These contracts are among the investment vehicles used to reduce
our economic exposure related to our nonqualified deferred compensation plans. Note 25 provides the details of our positions in prepaid
forward contracts.
24. Share-Based Compensation
We maintain a long-term incentive plan (the Plan) for key team members and non-employee members of our Board
of Directors. The Plan allows us to grant equity-based compensation awards, including stock options, stock appreciation
rights, performance share units, restricted stock units, restricted stock awards or a combination of awards (collectively,
share-based awards). The number of unissued common shares reserved for future grants under the Plan was 14.0
million and 18.7 million at January 31, 2015 and February 1, 2014, respectively.
Compensation expense associated with share-based awards is recognized on a straight-line basis over the shorter
of the vesting period or the minimum required service period. Share-based compensation expense for continuing
operations recognized in the Consolidated Statements of Operations was $73 million, $106 million and $101 million
in 2014, 2013 and 2012, respectively. The related income tax benefit was $29 million, $41 million and $40 million in
2014, 2013 and 2012, respectively.
Share information includes all outstanding awards for continuing and discontinued operations.
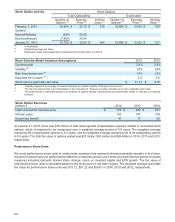
Stock Options
Through 2013, we granted nonqualified stock options to certain team members that generally vest and become
exercisable annually in equal amounts over a four-year period and expire 10 years after the grant date. We previously
granted options with a ten-year term to the non-employee members of our Board of Directors that vest immediately,
but are not exercisable until one year after the grant date. We used a Black-Scholes valuation model to estimate the
fair value of the options at the grant date.
52