Target 2014 Annual Report Download - page 59
Download and view the complete annual report
Please find page 59 of the 2014 Target annual report below. You can navigate through the pages in the report by either clicking on the pages listed below, or by using the keyword search tool below to find specific information within the annual report.-
 1
1 -
2
-
3
-
4
-
5
-
6
-
7
-
8
-
9
-
10
-
11
-
12
-
13
-
14
-
15
-
16
-
17
-
18
-
19
-
20
-
21
-
22
-
23
-
24
-
25
-
26
-
27
-
28
-
29
-
30
-
31
-
32
-
33
-
34
-
35
-
36
-
37
-
38
-
39
-
40
-
41
-
42
-
43
-
44
-
45
-
46
-
47
-
48
-
 49
49 -
 50
50 -
 51
51 -
 52
52 -
 53
53 -
 54
54 -
 55
55 -
 56
56 -
 57
57 -
 58
58 -
 59
59 -
 60
60 -
 61
61 -
 62
62 -
 63
63 -
 64
64 -
 65
65 -
 66
66 -
 67
67 -
 68
68 -
 69
69 -
70
-
71
-
72
-
73
-
74
-
75
-
76
-
77
-
78
-
79
-
80
-
81
-
82
 |
 |
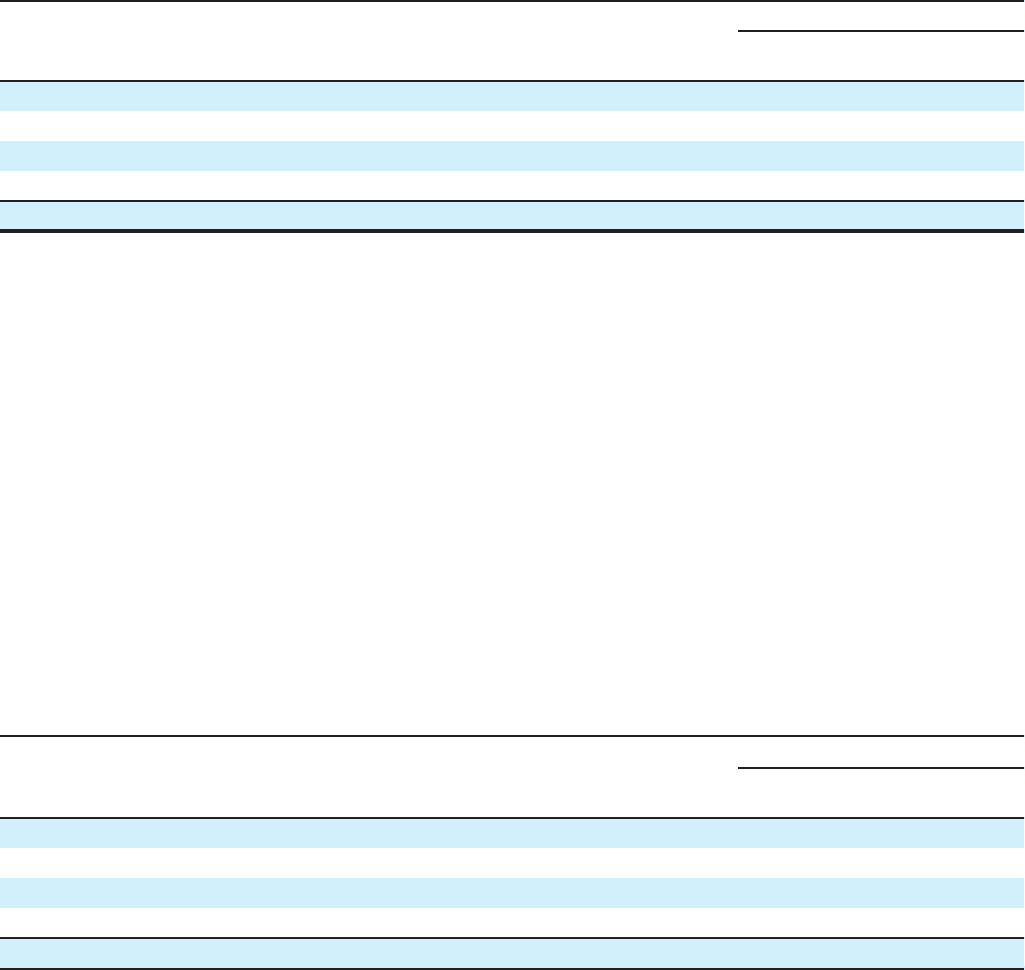
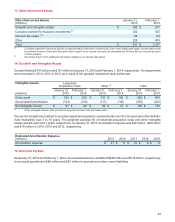
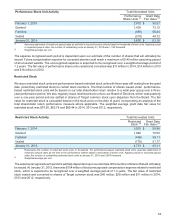
Performance Share Unit Activity Total Nonvested Units
Performance
Share Units (a) Grant Date
Fair Value (b)
February 1, 2014 2,870 $ 55.37
Granted 1,438 73.12
Forfeited (490) 56.44
Vested (218) 48.72
January 31, 2015 3,600 $ 63.16
(a) Assumes
attainment of maximum payout rates as set forth in the performance criteria based in thousands of share units. Applying actual
or expected payout rates, the number of outstanding units at January 31, 2015 was 1,136 thousand.
(b) Weighted average per unit.
The expense recognized each period is dependent upon our estimate of the number of shares that will ultimately be
issued. Future compensation expense for unvested awards could reach a maximum of $145 million assuming payout
of all unvested awards. The unrecognized expense is expected to be recognized over a weighted average period of
1.2 years. The fair value of performance share units vested and converted was $11 million in 2014, $14 million in 2013
and $16 million in 2012.
Restricted Stock
We issue restricted stock units and performance-based restricted stock units with three-year cliff vesting from the grant
date (collectively restricted stock) to certain team members. The final number of shares issued under performance-
based restricted stock units will be based on our total shareholder return relative to a retail peer group over a three-
year performance period. We also regularly issue restricted stock units to our Board of Directors, which vest quarterly
over a one-year period and are settled in shares of Target common stock upon departure from the Board. The fair
value for restricted stock is calculated based on the stock price on the date of grant, incorporating an analysis of the
total shareholder return performance measure where applicable. The weighted average grant date fair value for
restricted stock was $70.50, $62.76 and $60.44 in 2014, 2013 and 2012, respectively.
Restricted Stock Activity
February 1, 2014
Total Nonvested Units
Restricted Grant Date
Stock (a) Fair Value (b)
3,935 $ 58.98
Granted 1,992 70.50
Forfeited (436) 59.11
Vested
January 31, 2015
(778)
4,713 $
51.77
65.11
(a) Represents
the number of restricted stock units, in thousands. For performance-based restricted stock units, assumes attainment of
maximum payout rates as set forth in the performance criteria based in thousands of share units. Applying actual or expected payout
rates, the number of outstanding restricted stock units at January 31, 2015 was 3,897 thousand.
(b) Weighted average per unit.
The expense recognized each period is partially dependent upon our estimate of the number of shares that will ultimately
be issued. At January 31, 2015, there was $154 million of total unrecognized compensation expense related to restricted
stock, which is expected to be recognized over a weighted average period of 1.3 years. The fair value of restricted
stock vested and converted to shares of Target common stock was $40 million, $28 million and $11 million in 2014,
2013 and 2012, respectively.
54