Target 2014 Annual Report Download - page 61
Download and view the complete annual report
Please find page 61 of the 2014 Target annual report below. You can navigate through the pages in the report by either clicking on the pages listed below, or by using the keyword search tool below to find specific information within the annual report.-
 1
1 -
2
-
3
-
4
-
5
-
6
-
7
-
8
-
9
-
10
-
11
-
12
-
13
-
14
-
15
-
16
-
17
-
18
-
19
-
20
-
21
-
22
-
23
-
24
-
25
-
26
-
27
-
28
-
29
-
30
-
31
-
32
-
33
-
34
-
35
-
36
-
37
-
38
-
39
-
40
-
41
-
42
-
43
-
44
-
45
-
46
-
47
-
48
-
49
-
50
-
 51
51 -
 52
52 -
 53
53 -
 54
54 -
 55
55 -
 56
56 -
 57
57 -
 58
58 -
 59
59 -
 60
60 -
 61
61 -
 62
62 -
 63
63 -
 64
64 -
 65
65 -
 66
66 -
 67
67 -
 68
68 -
 69
69 -
 70
70 -
 71
71 -
72
-
73
-
74
-
75
-
76
-
77
-
78
-
79
-
80
-
81
-
82
 |
 |

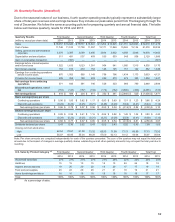
retirement and prior to Medicare eligibility, team members also become eligible for certain health care benefits if they
meet minimum age and service requirements and agree to contribute a portion of the cost.
Change in Projected Benefit Obligation Pension Benefits
Qualified Plans Nonqualified Plans
Postretirement
Health Care Benefits
2014 2013
$ 73 $ 121
(millions)
Benefit obligation at beginning of period
2014 2013 2014 2013
$ 3,173 $ 3,164 $ 35 $ 37
Service cost 111 117 1 1 5 6
Interest cost 148 136 1 1 2 2
Actuarial (gain)/loss 556 (125) 9 — (10) (3)
Participant contributions 3 1 — — 4 5
Benefits paid (147) (122) (3) (4) (9) (14)
Plan amendments
Benefit obligation at end of period
—
$ 3,844 $
2
3,173
—
$ 43 $
—
35
(9)
$ 56 $
(44)
73
Change in Plan Assets Pension Benefits
Qualified Plans Nonqualified Plans
Postretirement
Health Care Benefits
(millions) 2014 2013 2014 2013 2014 2013
Fair value of plan assets at beginning of
period $ 3,267 $ 3,223 $ — $ — $ — $ —
Actual return on plan assets 507 161 — — — —
Employer contributions 154 4 3 4 5 9
Participant contributions 3 1 — — 4 5
Benefits paid (147) (122) (3) (4) (9) (14)
Fair value of plan assets at end of
period 3,784 3,267 — — — —
Benefit obligation at end of period 3,844 3,173 43 35 56 73
Funded/(underfunded) status $ (60)$ 94 $ (43) $ (35) $ (56) $ (73)
Recognition of Funded/(Underfunded) Status Qualified Plans Nonqualified Plans (a)
(millions) 2014 2013 2014 2013
Other noncurrent assets $ — $ 112 $ — $ —
Accrued and other current liabilities (1) (2) (8) (9)
Other noncurrent liabilities (59) (16) (91) (99)
Net amounts recognized $ (60) $ 94 $ (99) $ (108)
(a) Includes postretirement health care benefits.
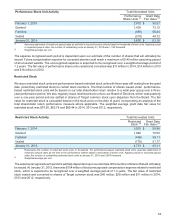
The following table summarizes the amounts recorded in accumulated other comprehensive income, which have not
yet been recognized as a component of net periodic benefit expense:
Amounts in Accumulated Other Comprehensive Income
Pension Plans
Postretirement
Health Care Plans
(millions)
Net actuarial loss
Prior service credits
Amounts in accumulated other comprehensive income
$
$
2014
1,018 $
(69)
949 $
2013
792
(80)
712
$
$
2014
33 $
(55)
(22) $
2013
49
(62)
(13)
56