Target 2014 Annual Report Download - page 23
Download and view the complete annual report
Please find page 23 of the 2014 Target annual report below. You can navigate through the pages in the report by either clicking on the pages listed below, or by using the keyword search tool below to find specific information within the annual report.-
 1
1 -
2
-
3
-
4
-
5
-
6
-
7
-
8
-
9
-
10
-
11
-
12
-
 13
13 -
 14
14 -
 15
15 -
 16
16 -
 17
17 -
 18
18 -
 19
19 -
 20
20 -
 21
21 -
 22
22 -
 23
23 -
 24
24 -
 25
25 -
 26
26 -
 27
27 -
 28
28 -
 29
29 -
 30
30 -
 31
31 -
 32
32 -
 33
33 -
34
-
35
-
36
-
37
-
38
-
39
-
40
-
41
-
42
-
43
-
44
-
45
-
46
-
47
-
48
-
49
-
50
-
51
-
52
-
53
-
54
-
55
-
56
-
57
-
58
-
59
-
60
-
61
-
62
-
63
-
64
-
65
-
66
-
67
-
68
-
69
-
70
-
71
-
72
-
73
-
74
-
75
-
76
-
77
-
78
-
79
-
80
-
81
-
82
 |
 |
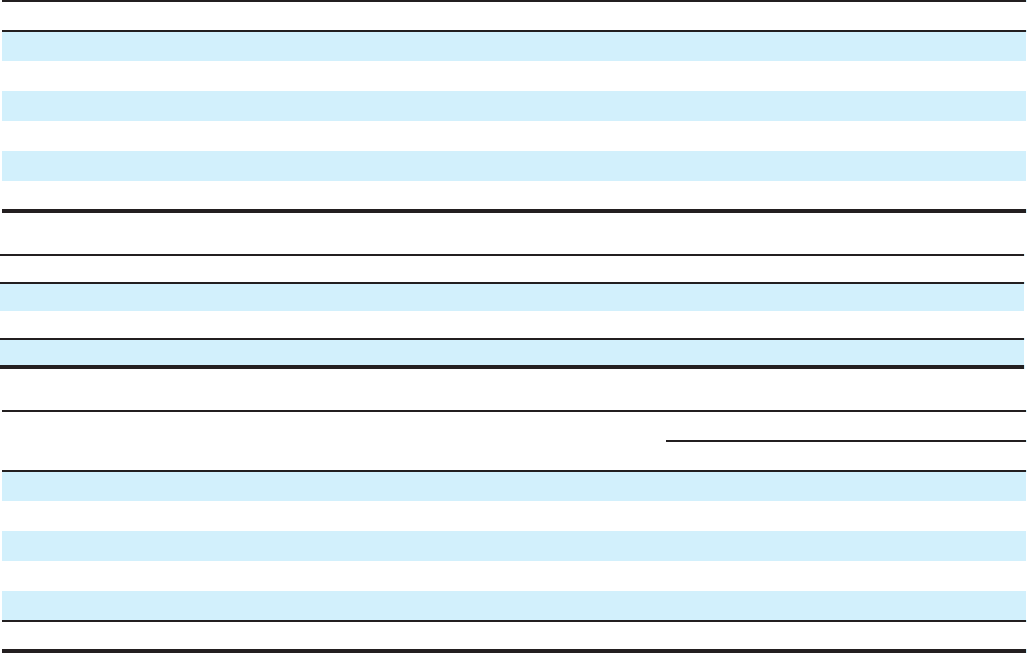
Sales
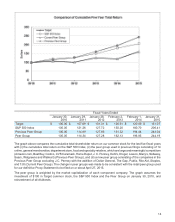
Sales include merchandise sales, net of expected returns, and gift card breakage. Refer to Note 2 of the Financial
Statements for a definition of gift card breakage. The increase in 2014 sales reflects a 1.3 percent increase in comparable
sales and the contribution from new stores. The sales decline in 2013 reflected the impact of an additional week in
2012 and a decline in comparable sales, partially offset by the contribution from new stores. Inflation did not materially
affect sales in any period presented.
Comparable sales is a measure that highlights the performance of our existing stores and digital channel sales by
measuring the change in sales for a period over the comparable, prior-year period of equivalent length. Comparable
sales include all sales from stores open at least 13 months. Digital channel sales include all sales initiated through
mobile applications and our conventional websites, including those of acquired entities from the date of acquisition,
and may be fulfilled through our distribution centers or our stores. Comparable sales measures vary across the retail
industry. As a result, our comparable sales calculation is not necessarily comparable to similarly titled measures
reported by other companies.
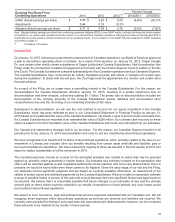
Comparable Sales 2014 2013 2012
Comparable sales change 1.3 % (0.4)% 2.7%
Drivers of change in comparable sales:
Number of transactions (0.2)% (2.7)% 0.5%
Average transaction amount 1.5 % 2.3 % 2.3%
Selling price per unit 3.2 % 1.6 % 1.3%
Units per transaction (1.6)% 0.7 % 1.0%
Contribution to Comparable Sales Change 2014 2013 2012
Stores channel comparable sales change 0.7% (0.7)% 2.6%
Digital channel contribution to comparable sales change 0.7 0.3 0.1
Total comparable sales change 1.3% (0.4)% 2.7%
Note: Amounts may not foot due to rounding.
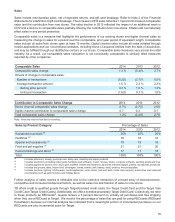
Sales by Product Category Percentage of Sales
2014 2013 2012
Household essentials (a) 25% 25% 25%
Hardlines (b) 18 18 18
Apparel and accessories (c) 19 19 19
Food and pet supplies (d) 21 21 20
Home furnishings and décor (e) 17 17 18
Total 100% 100% 100%
(a)
Includes pharmacy, beauty, personal
care, baby care, cleaning and paper products.
(b)
Includes
electronics (including video game hardware and software), music, movies, books, computer software, sporting goods and toys.
(c)
Includes
apparel for women, men, boys, girls, toddlers, infants and newborns, as well as intimate apparel, jewelry, accessories and shoes.
(d)
Includes dry grocery,
dairy, frozen food, beverages, candy, snacks, deli, bakery, meat, produce and pet supplies.
(e)
Includes
furniture, lighting, kitchenware, small appliances, home décor, bed and bath, home improvement, automotive and seasonal
merchandise such as patio furniture and holiday décor.
Further analysis of sales metrics is infeasible due to the collective interaction of a broad array of macroeconomic,
competitive and consumer behavioral factors, as well as sales mix and transfer of sales to new stores.
TD offers credit to qualified guests through Target-branded credit cards: the Target Credit Card and the Target Visa
Credit Card (Target Credit Cards). Additionally, we offer a branded proprietary Target Debit Card. Collectively, we refer
to these products as REDcards®. Guests receive a 5 percent discount on virtually all purchases and free shipping
when they use a REDcard at Target. We monitor the percentage of sales that are paid for using REDcards (REDcard
Penetration) because our internal analysis has indicated that a meaningful portion of incremental purchases on our
REDcards are also incremental sales for Target.
18