Target 2014 Annual Report Download - page 66
Download and view the complete annual report
Please find page 66 of the 2014 Target annual report below. You can navigate through the pages in the report by either clicking on the pages listed below, or by using the keyword search tool below to find specific information within the annual report.-
 1
1 -
2
-
3
-
4
-
5
-
6
-
7
-
8
-
9
-
10
-
11
-
12
-
13
-
14
-
15
-
16
-
17
-
18
-
19
-
20
-
21
-
22
-
23
-
24
-
25
-
26
-
27
-
28
-
29
-
30
-
31
-
32
-
33
-
34
-
35
-
36
-
37
-
38
-
39
-
40
-
41
-
42
-
43
-
44
-
45
-
46
-
47
-
48
-
49
-
50
-
51
-
52
-
53
-
54
-
55
-
 56
56 -
 57
57 -
 58
58 -
 59
59 -
 60
60 -
 61
61 -
 62
62 -
 63
63 -
 64
64 -
 65
65 -
 66
66 -
 67
67 -
 68
68 -
 69
69 -
 70
70 -
 71
71 -
 72
72 -
 73
73 -
 74
74 -
 75
75 -
 76
76 -
77
-
78
-
79
-
80
-
81
-
82
 |
 |

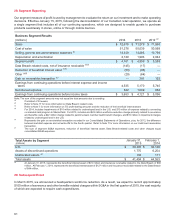
28. Segment Reporting
Our segment measure of profit is used by management to evaluate the return on our investment and to make operating
decisions. Effective January 15, 2015, following the deconsolidation of our Canadian retail operation, we operate as
a single segment that includes all of our continuing operations, which are designed to enable guests to purchase
products seamlessly in stores, online or through mobile devices.
Business Segment Results
(millions) 2014 2013 2012 (a)
Sales $ 72,618 $ 71,279 $ 71,960
Cost of sales 51,278 50,039 50,568
Selling, general and administrative expenses (f) 14,450 14,285 13,759
Depreciation and amortization 2,129 1,996 2,044
Segment profit $ 4,761 $ 4,959 $ 5,589
Data Breach-related costs, net of insurance receivable (b)(f) (145) (17) —
Reduction of beneficial interest asset (c)(f) (53) (98) —
Other (d)(f) (29) (64) —
Gain on receivables transaction (e) — 391 152
Earnings from continuing operations before interest expense and income
taxes 4,535 5,170 5,740
Net interest expense 882 1,049 684
Earnings from continuing operations before income taxes $ 3,653 $ 4,121 $ 5,056
Note:
The sum of the segment amounts may not equal the total amounts due to rounding.
(a) Consisted of 53 weeks.
(b) Refer to Note 17 for more information on Data Breach related costs.
(c) Refer to Note 7 for more information on TD profit sharing amounts and the reduction of the beneficial interest asset.
(d) For 2014, includes impairments of $16 million related to undeveloped land in the U.S. and $13 million of expense related to converting
co-branded card program to MasterCard. For 2013, includes and $23 million workforce-reduction charge primarily related to severance
and benefits costs, a $22 million charge related to part-time team member health benefit changes, and $19 million in impairment charges
related to undeveloped land in the U.S.
(e) Represents the gain on receivables transaction recorded in our Consolidated Statements of Operations, plus, for 2012, the difference
between bad debt expense and net write-offs for the fourth quarter. Refer to Note 7 for more information on our credit card receivables
transaction.
(f) The sum of segment SG&A expenses, reduction of beneficial interest asset, Data Breach-related costs and other charges equal
consolidated SG&A expenses.
Total Assets by Segment
(millions)
U.S.
Assets of discontinued operations
Unallocated assets (a)
January 31,
2015
February 1,
2014
$ 39,495 $ 38,128
1,775 6,254
134 171
Total assets $ 41,404 $ 44,553
(a) At
January 31, 2015, represents the beneficial interest asset of $74 million and insurance receivable related to the Data Breach of $60
million. At February 1, 2014, represents the beneficial interest asset of $127 million and insurance receivable related to the Data Breach
of $44 million.
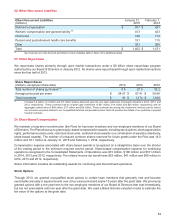
29. Subsequent Event
In March 2015, we announced a headquarters workforce reduction. As a result, we expect to record approximately
$100 million of severance and other benefits-related charges within SG&A in the first quarter of 2015, the vast majority
of which are expected to require cash expenditures.
61