Target 2014 Annual Report Download - page 36
Download and view the complete annual report
Please find page 36 of the 2014 Target annual report below. You can navigate through the pages in the report by either clicking on the pages listed below, or by using the keyword search tool below to find specific information within the annual report.-
 1
1 -
2
-
3
-
4
-
5
-
6
-
7
-
8
-
9
-
10
-
11
-
12
-
13
-
14
-
15
-
16
-
17
-
18
-
19
-
20
-
21
-
22
-
23
-
24
-
25
-
 26
26 -
 27
27 -
 28
28 -
 29
29 -
 30
30 -
 31
31 -
 32
32 -
 33
33 -
 34
34 -
 35
35 -
 36
36 -
 37
37 -
 38
38 -
 39
39 -
 40
40 -
 41
41 -
 42
42 -
 43
43 -
 44
44 -
 45
45 -
 46
46 -
47
-
48
-
49
-
50
-
51
-
52
-
53
-
54
-
55
-
56
-
57
-
58
-
59
-
60
-
61
-
62
-
63
-
64
-
65
-
66
-
67
-
68
-
69
-
70
-
71
-
72
-
73
-
74
-
75
-
76
-
77
-
78
-
79
-
80
-
81
-
82
 |
 |

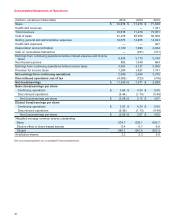
Consolidated Statements of Operations
(millions, except per share data) 2014 2013 2012
Sales $
Credit card revenues
Total revenues
Cost of sales
Selling, general and administrative expenses
Credit card expenses
Depreciation and amortization
Gain on receivables transaction
Earnings from continuing operations before interest expense and income
taxes
Net interest expense
Earnings from continuing operations before income taxes
Provision for income taxes
72,618 $
—
72,618
51,278
14,676
—
2,129
—
4,535
882
3,653
1,204
71,279 $
—
71,279
50,039
14,465
—
1,996
(391)
5,170
1,049
4,121
1,427
71,960
1,341
73,301
50,568
14,643
467
2,044
(161)
5,740
684
5,056
1,741
Net earnings from continuing operations
Discontinued operations, net of tax
Net (loss)/earnings $
Basic (loss)/earnings per share
Continuing operations $
Discontinued operations
Net (loss)/earnings per share $
2,449
(4,085)
(1,636) $
3.86 $
(6.44)
(2.58) $
2,694
(723)
1,971 $
4.24 $
(1.14)
3.10 $
3,315
(316)
2,999
5.05
(0.48)
4.57
Diluted (loss)/earnings per share
Continuing operations $
Discontinued operations
Net (loss)/earnings per share $
Weighted average common shares outstanding
Basic
Dilutive effect of share-based awards
3.83 $
(6.38)
(2.56) $
634.7
5.4
4.20 $
(1.13)
3.07 $
635.1
6.7
5.00
(0.48)
4.52
656.7
6.6
Diluted 640.1 641.8 663.3
Antidilutive shares 3.3 2.3 5.0
See accompanying Notes to Consolidated Financial Statements.
31