Target 2014 Annual Report Download - page 24
Download and view the complete annual report
Please find page 24 of the 2014 Target annual report below. You can navigate through the pages in the report by either clicking on the pages listed below, or by using the keyword search tool below to find specific information within the annual report.-
 1
1 -
2
-
3
-
4
-
5
-
6
-
7
-
8
-
9
-
10
-
11
-
12
-
13
-
 14
14 -
 15
15 -
 16
16 -
 17
17 -
 18
18 -
 19
19 -
 20
20 -
 21
21 -
 22
22 -
 23
23 -
 24
24 -
 25
25 -
 26
26 -
 27
27 -
 28
28 -
 29
29 -
 30
30 -
 31
31 -
 32
32 -
 33
33 -
 34
34 -
35
-
36
-
37
-
38
-
39
-
40
-
41
-
42
-
43
-
44
-
45
-
46
-
47
-
48
-
49
-
50
-
51
-
52
-
53
-
54
-
55
-
56
-
57
-
58
-
59
-
60
-
61
-
62
-
63
-
64
-
65
-
66
-
67
-
68
-
69
-
70
-
71
-
72
-
73
-
74
-
75
-
76
-
77
-
78
-
79
-
80
-
81
-
82
 |
 |
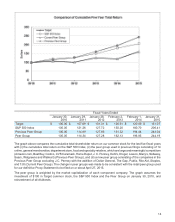
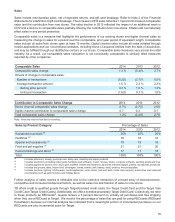
REDcard Penetration 2014 2013 2012
Target Credit Cards 9.7% 9.3% 7.9%
Target Debit Card 11.2 9.9 5.7
Total REDcard Penetration 20.9% 19.3% 13.6%
Note: The sum of Target Credit Cards and Target Debit Card penetration may not equal Total REDcard Penetration due to rounding.
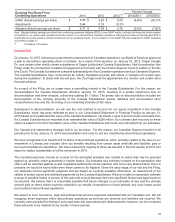
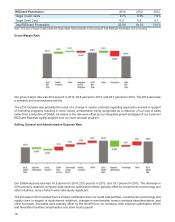
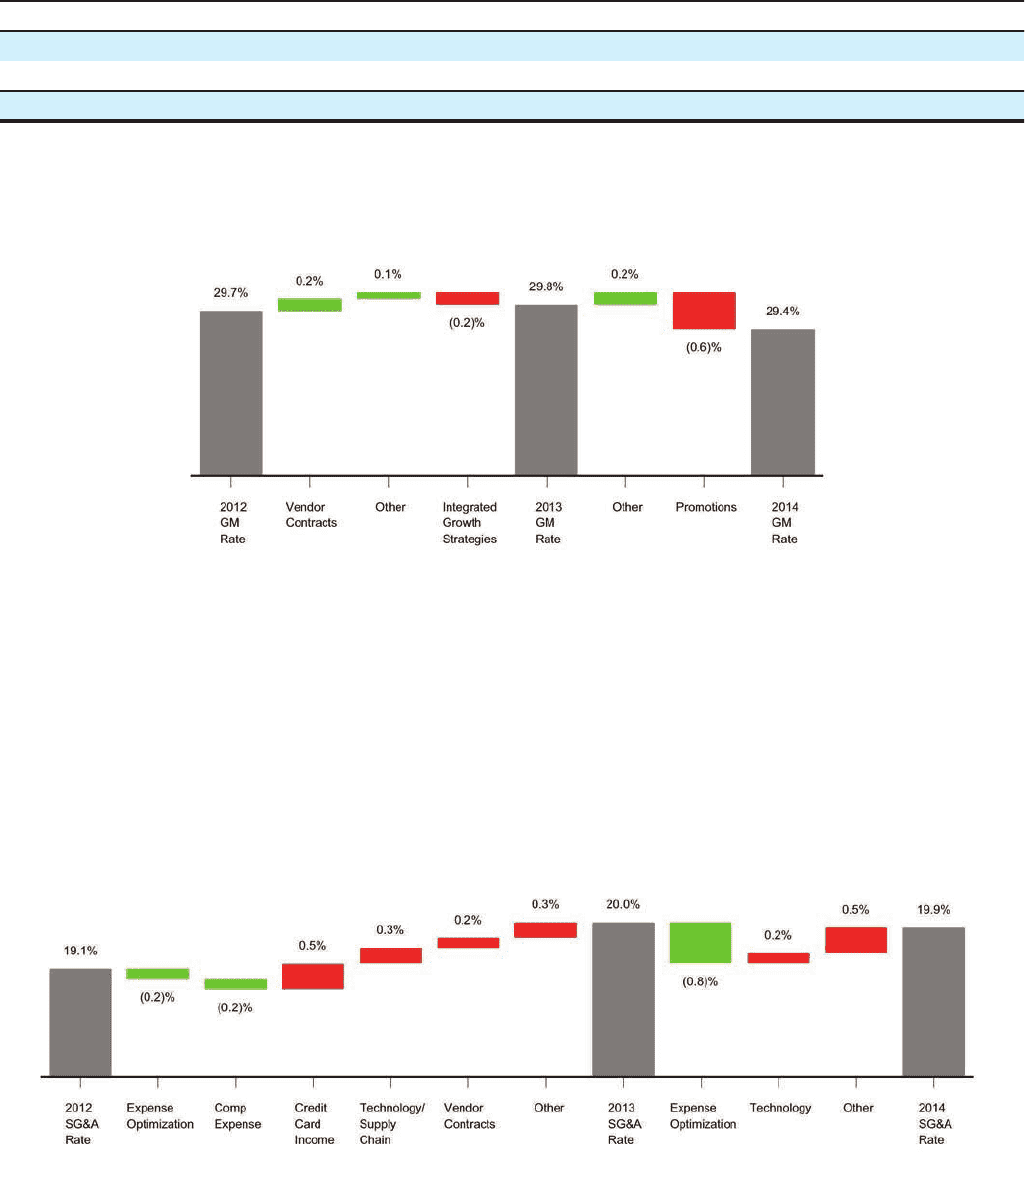
Gross Margin Rate
Our gross margin rate was 29.4 percent in 2014, 29.8 percent in 2013, and 29.7 percent in 2012. The 2014 decrease
is primarily due to promotional activity.
The 2013 increase was primarily the result of a change in vendor contracts regarding payments received in support
of marketing programs resulting in more vendor consideration being recognized as a reduction of our cost of sales
rather than a reduction of SG&A. Increases to the rate were offset by our integrated growth strategies of our 5 percent
REDcard Rewards loyalty program and our store remodel program.
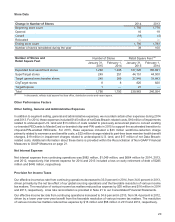
Selling, General and Administrative Expense Rate
Our SG&A expense rate was 19.9 percent in 2014, 20.0 percent in 2013, and 19.1 percent in 2012. The decrease in
2014 primarily related to company-wide expense optimization efforts, partially offset by investments in technology and
other initiatives, none of which were individually significant.
The increase in 2013 resulted from a smaller contribution from our credit card portfolio, investments in technology and
supply chain in support of multichannel initiatives, changes in merchandise vendor contracts described above, and
other increases. Increases were partially offset by the benefit from our company-wide expense optimization efforts
and favorable incentive compensation and store hourly payroll.
19