Target 2014 Annual Report Download - page 25
Download and view the complete annual report
Please find page 25 of the 2014 Target annual report below. You can navigate through the pages in the report by either clicking on the pages listed below, or by using the keyword search tool below to find specific information within the annual report.-
 1
1 -
2
-
3
-
4
-
5
-
6
-
7
-
8
-
9
-
10
-
11
-
12
-
13
-
14
-
 15
15 -
 16
16 -
 17
17 -
 18
18 -
 19
19 -
 20
20 -
 21
21 -
 22
22 -
 23
23 -
 24
24 -
 25
25 -
 26
26 -
 27
27 -
 28
28 -
 29
29 -
 30
30 -
 31
31 -
 32
32 -
 33
33 -
 34
34 -
 35
35 -
36
-
37
-
38
-
39
-
40
-
41
-
42
-
43
-
44
-
45
-
46
-
47
-
48
-
49
-
50
-
51
-
52
-
53
-
54
-
55
-
56
-
57
-
58
-
59
-
60
-
61
-
62
-
63
-
64
-
65
-
66
-
67
-
68
-
69
-
70
-
71
-
72
-
73
-
74
-
75
-
76
-
77
-
78
-
79
-
80
-
81
-
82
 |
 |
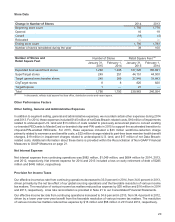
Store Data
Change in Number of Stores 2014 2013
Beginning store count 1,793 1,778
Opened 16 19
Closed (19) (4)
Relocated — —
Ending store count 1,790 1,793
Number of stores remodeled during the year 39 100
Number of Stores and
Retail Square Feet Number of Stores
January 31,
2015
February 1,
2014
Retail Square Feet (a)
January 31,
2015
February 1,
2014
Expanded food assortment stores 1,292 1,245 167,026 160,891
SuperTarget stores 249 251 44,151 44,500
Target general merchandise stores 240 289 27,945 33,843
CityTarget stores 8 8 820 820
TargetExpress 1 — 21 —
Total 1,790 1,793 239,963 240,054
(a) In thousands, reflects total square feet less office, distribution center and vacant space.
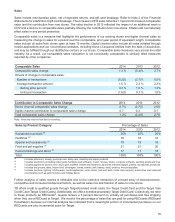
Other Performance Factors
Other Selling, General and Administrative Expenses
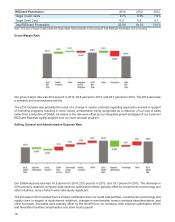
In addition to segment selling, general and administrative expenses, we recorded certain other expenses during 2014
and 2013. For 2014, these expenses included $145 million of net Data Breach-related costs, $16 million of impairments
related to undeveloped U.S. land and $13 million of costs related to previously announced plans to convert existing
co-branded REDcards to MasterCard co-branded chip-and-PIN cards in 2015 to support the accelerated transition to
chip-and-PIN-enabled REDcards. For 2013, these expenses included a $23 million workforce-reduction charge
primarily related to severance and benefits costs, a $22 million charge related to part-time team member health benefit
changes, $19 million in impairment charges related to undeveloped U.S. land, and $17 million of net Data Breach-
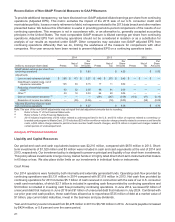
related costs. Additional information about these items is provided within the Reconciliation of Non-GAAP Financial
Measures to GAAP Measures on page 21.
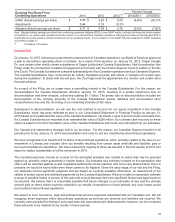
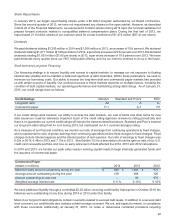
Net Interest Expense
Net interest expense from continuing operations was $882 million, $1,049 million, and $684 million for 2014, 2013,
and 2012, respectively. Net interest expense for 2014 and 2013 included a loss on early retirement of debt of $285
million and $445 million, respectively.
Provision for Income Taxes
Our effective income tax rate from continuing operations decreased to 33.0 percent in 2014, from 34.6 percent in 2013,
driven primarily by the net tax effect of our global sourcing operations and the favorable resolution of various income
tax matters. The resolution of various income tax matters reduced tax expense by $35 million and $16 million in 2014
and 2013, respectively. A tax rate reconciliation is provided in Note 21 to our Consolidated Financial Statements.
Our effective income tax rate from continuing operations increased to 34.6 percent in 2013, from 34.4 percent in 2012,
driven by a lower year-over-year benefit from the favorable resolution of various income tax matters. The resolution
of various income tax matters reduced tax expense by $16 million and $58 million in 2013 and 2012, respectively.
20