Target 2014 Annual Report Download - page 4
Download and view the complete annual report
Please find page 4 of the 2014 Target annual report below. You can navigate through the pages in the report by either clicking on the pages listed below, or by using the keyword search tool below to find specific information within the annual report.-
 1
1 -
 2
2 -
 3
3 -
 4
4 -
 5
5 -
 6
6 -
 7
7 -
 8
8 -
 9
9 -
 10
10 -
 11
11 -
 12
12 -
 13
13 -
 14
14 -
 15
15 -
16
-
17
-
18
-
19
-
20
-
21
-
22
-
23
-
24
-
25
-
26
-
27
-
28
-
29
-
30
-
31
-
32
-
33
-
34
-
35
-
36
-
37
-
38
-
39
-
40
-
41
-
42
-
43
-
44
-
45
-
46
-
47
-
48
-
49
-
50
-
51
-
52
-
53
-
54
-
55
-
56
-
57
-
58
-
59
-
60
-
61
-
62
-
63
-
64
-
65
-
66
-
67
-
68
-
69
-
70
-
71
-
72
-
73
-
74
-
75
-
76
-
77
-
78
-
79
-
80
-
81
-
82
 |
 |
91872_Guts.indd 2 4/14/15 5:20 PM
Target 2014 Annual Report 2014 2013 2012 (a) 2011 2010 2009
FINANCIAL RESULTS: (in millions)
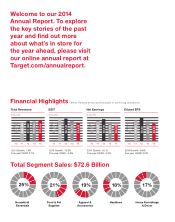
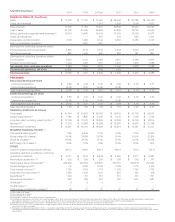
Sales $ 72,618 $ 71,279 $ 71,960 $ 68,466 $ 65,786 $ 63,435
Credit card revenues — — 1,341 1,399 1,604 1,922
Total revenues 72,618 71,279 73,301 69,865 67,390 65,357
Cost of sales 51,278 50,039 50,568 47,860 45,725 44,062
Selling, general and administrative expenses (b) 14,676 14,465 14,643 14,032 13,469 13,078
Credit card expenses — — 467 446 860 1,521
Depreciation and amortization 2,129 1,996 2,044 2,084 2,084 2,023
Gain on receivables transaction — (391) (161) — — —
Earnings from continuing operations before
interest expense and income taxes (c) 4,535 5,170 5,740 5,443 5,252 4,673
Net interest expense 882 1,049 684 822 757 801
Earnings from continuing operations before
income taxes 3,653 4,121 5,056 4,621 4,495 3,872
Provision for income taxes 1,204 1,427 1,741 1,572 1,575 1,384
Net earnings from continuing operations 2,449 2,694 3,315 3,049 2,920 2,488
Discontinued operations, net of tax (4,085) (723) (316) (120) — —
Net (loss)/earnings $ (1,636) $ 1,971 $ 2,999 $ 2,929 $ 2,920 $ 2,488
PER SHARE:
Basic (loss)/earnings per share
Continuing operations $ 3.86 $ 4.24 $ 5.05 $ 4.49 $ 4.03 $ 3.31
Discontinued operations (6.44) (1.14) (0.48) (0.18) — —
Net (loss)/earnings per share $ (2.58) $ 3.10 $ 4.57 $ 4.31 $ 4.03 $ 3.31
Diluted (loss)/earnings per share
Continuing operations $ 3.83 $ 4.20 $ 5.00 $ 4.46 $ 4.00 $ 3.30
Discontinued operations (6.38) (1.13) (0.48) (0.18) — —
Net (loss)/earnings per share $ (2.56) $ 3.07 $ 4.52 $ 4.28 $ 4.00 $ 3.30
Cash dividends declared $ 1.99 $ 1.65 $ 1.38 $ 1.15 $ 0.92 $ 0.67
FINANCIAL POSITION: (in millions)
Total assets $ 41,404 $ 44,553 $ 48,16 3 $ 46,630 $ 43,705 $ 44,533
Capital expenditures (d) $ 1,786 $ 1,886 $ 2,345 $ 2,476 $ 2,129 $ 1,729
Long-term debt, including current portion (d) $ 12,796 $ 12,572 $ 16,359 $ 16,225 $ 15,726 $ 16,814
Net debt (d)(e) $ 11,276 $ 12,569 $ 16,284 $ 16,081 $ 14,597 $ 15,288
Shareholders’ investment $ 13,997 $ 16,231 $ 16,558 $ 15,821 $ 15,487 $ 15,347
SEGMENT FINANCIAL RATIOS: (g)
Comparable sales growth (f) 1.3% (0.4)% 2.7% 3.0% 2.1% (2.5)%
Gross margin (% of sales) 29.4% 29.8% 29.7% 30.1% 30.5% 30.5%
SG&A (% of sales) (g) 19.9% 20.0% 19.1% 19.1% 19.3% 20.0%
EBIT margin (% of sales) (g) 6.6% 7.0% 7. 8% 8.0% 8.0% 7.4%
OTHER:
Common shares outstanding (in millions) 640.2 632.9 645.3 669.3 704.0 744.6
Operating cash flow provided by continuing
operations (in millions) $ 5,131 $ 7,519 $ 5,568 $ 5,520 $ 5,271 $ 5,881
Revenue per square foot (d)(h) $ 302 $ 298 $ 299 $ 294 $ 290 $ 287
Retail square feet (in thousands) (d) 239,963 240,054 237,847 235,721 233,618 231,952
Square footage growth (d) —% 0.9% 0.9% 0.9% 0.7% 4.2%
Total number of stores (d) 1,790 1,793 1,778 1,763 1,750 1,740
Expanded food assortment (d) 1,292 1,245 1,131 875 462 108
SuperTarget (d) 249 251 251 251 251 251
General merchandise (d) 240 289 391 637 1,037 1,381
CityTarget (d) 8 8 5 — — —
TargetExpress (d) 1 — — — — —
Total number of distribution centers (d) 38 37 37 37 37 37
(a) Consisted of 53 weeks.
(b) Also referred to as SG&A.
(c) Also referred to as EBIT.
(d) Represents amounts attributable to continuing operations.
(e) Including current portion and short-term notes payable, net of short-term investments of $1,520 million, $3 million, $75 million, $144 million $1,129 million and $$1,526 million, respectively.
Management believes this measure is an indicator of our level of financial leverage because short-term investments are available to pay debt maturity obligations.
(f) See definition of comparable sales in Item 7, Management’s Discussion and Analysis of Financial Condition and Results of Operations.
(g) Effective January 15, 2015, we operate as a single segment which includes all of our continuing operations, excluding net interest expense, data breach related costs and certain other expenses
which are discretely managed.
(h) Represents revenue per square foot which is calculated using rolling 13 month average square feet and a rolling four quarters of average revenue. In 2012, revenue per square foot was
calculated excluding the 53rd week in order to provide a more useful comparison to other years. Using total reported revenues for 2012 (including the 53rd week) resulted in revenue per square
foot of $304.