Target 2014 Annual Report Download - page 27
Download and view the complete annual report
Please find page 27 of the 2014 Target annual report below. You can navigate through the pages in the report by either clicking on the pages listed below, or by using the keyword search tool below to find specific information within the annual report.-
 1
1 -
2
-
3
-
4
-
5
-
6
-
7
-
8
-
9
-
10
-
11
-
12
-
13
-
14
-
15
-
16
-
 17
17 -
 18
18 -
 19
19 -
 20
20 -
 21
21 -
 22
22 -
 23
23 -
 24
24 -
 25
25 -
 26
26 -
 27
27 -
 28
28 -
 29
29 -
 30
30 -
 31
31 -
 32
32 -
 33
33 -
 34
34 -
 35
35 -
 36
36 -
 37
37 -
38
-
39
-
40
-
41
-
42
-
43
-
44
-
45
-
46
-
47
-
48
-
49
-
50
-
51
-
52
-
53
-
54
-
55
-
56
-
57
-
58
-
59
-
60
-
61
-
62
-
63
-
64
-
65
-
66
-
67
-
68
-
69
-
70
-
71
-
72
-
73
-
74
-
75
-
76
-
77
-
78
-
79
-
80
-
81
-
82
 |
 |
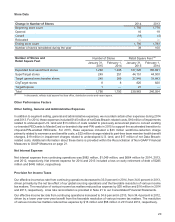
Share Repurchases
In January 2012, we began repurchasing shares under a $5 billion program authorized by our Board of Directors.
Since the second quarter of 2013, we have not repurchased any shares on the open market. However, as described
in Note 23 of the Financial Statements, we reacquired 0.8 million shares during 2014 upon the noncash settlement of
prepaid forward contracts related to nonqualified deferred compensation plans. During the first half of 2013, we
repurchased 21.9 million shares of our common stock for a total investment of $1,474 million ($67.41 per share).
Dividends
We paid dividends totaling $1,205 million in 2014 and $1,006 million in 2013, an increase of 19.8 percent. We declared
dividends totaling $1,271 million ($1.99 per share) in 2014, a per share increase of 20.6 percent over 2013. We declared
dividends totaling $1,051 million ($1.65 per share) in 2013, a per share increase of 19.6 percent over 2012. We have
paid dividends every quarter since our 1967 initial public offering, and it is our intent to continue to do so in the future.
Short-term and Long-term Financing
Our financing strategy is to ensure liquidity and access to capital markets, to manage our net exposure to floating
interest rate volatility and to maintain a balanced spectrum of debt maturities. Within these parameters, we seek to
minimize our borrowing costs. Our ability to access the long-term debt and commercial paper markets has provided
us with ample sources of liquidity. Our continued access to these markets depends on multiple factors, including the
condition of debt capital markets, our operating performance and maintaining strong debt ratings. As of January 31,
2015, our credit ratings were as follows:
Credit Ratings Moody's Standard and Poor's Fitch
Long-term debt A2 A A-
Commercial paper P-1 A-1 F2
If our credit ratings were lowered, our ability to access the debt markets, our cost of funds and other terms for new
debt issuances could be adversely impacted. Each of the credit rating agencies reviews its rating periodically and
there is no guarantee our current credit ratings will remain the same as described above. Standard and Poor's lowered
our long-term debt rating from A+ to A during 2014, but maintained our A-1 commercial paper rating.
As a measure of our financial condition, we monitor our ratio of earnings from continuing operations to fixed charges,
which represents the ratio of pretax earnings from continuing operations before fixed charges to fixed charges. Fixed
charges include interest expense and the interest portion of rent expense. Our ratio of earnings to fixed charges was
6.02x in 2014, 6.48x in 2013 and 7.10x in 2012. See Exhibit (12) for a description of how the gain on sale of our U.S.
credit card receivable portfolio and loss on early retirement of debt affected the 2014, 2013 and 2012 calculations.
In 2014 and 2013, we funded our peak sales season working capital needs through internally generated funds and
the issuance of commercial paper.
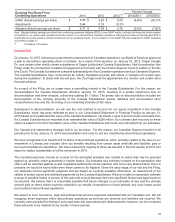
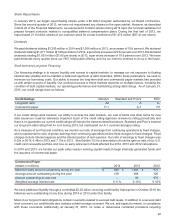
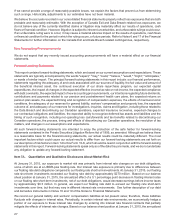
Commercial Paper
(dollars in millions) 2014 2013 2012
Maximum daily amount outstanding during the year $ 590 $ 1,465 $ 970
Average amount outstanding during the year 129 408 120
Amount outstanding at year-end — 80 970
Weighted average interest rate 0.11% 0.13% 0.16%
We have additional liquidity through a committed $2.25 billion revolving credit facility that expires in October 2018. No
balances were outstanding at any time during 2014 or 2013 under this facility.
Most of our long-term debt obligations contain covenants related to secured debt levels. In addition to a secured debt
level covenant, our credit facility also contains a debt leverage covenant. We are, and expect to remain, in compliance
with these covenants. Additionally, at January 31, 2015, no notes or debentures contained provisions requiring
22