Target 2014 Annual Report Download - page 22
Download and view the complete annual report
Please find page 22 of the 2014 Target annual report below. You can navigate through the pages in the report by either clicking on the pages listed below, or by using the keyword search tool below to find specific information within the annual report.-
 1
1 -
2
-
3
-
4
-
5
-
6
-
7
-
8
-
9
-
10
-
11
-
 12
12 -
 13
13 -
 14
14 -
 15
15 -
 16
16 -
 17
17 -
 18
18 -
 19
19 -
 20
20 -
 21
21 -
 22
22 -
 23
23 -
 24
24 -
 25
25 -
 26
26 -
 27
27 -
 28
28 -
 29
29 -
 30
30 -
 31
31 -
 32
32 -
33
-
34
-
35
-
36
-
37
-
38
-
39
-
40
-
41
-
42
-
43
-
44
-
45
-
46
-
47
-
48
-
49
-
50
-
51
-
52
-
53
-
54
-
55
-
56
-
57
-
58
-
59
-
60
-
61
-
62
-
63
-
64
-
65
-
66
-
67
-
68
-
69
-
70
-
71
-
72
-
73
-
74
-
75
-
76
-
77
-
78
-
79
-
80
-
81
-
82
 |
 |

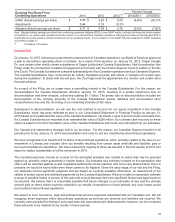
See Note 6 of the Financial Statements for further information regarding our Canada exit.
Data Breach
In the fourth quarter of 2013, we experienced a data breach in which an intruder stole certain payment card and other
guest information from our network (the Data Breach). In 2014, we recorded $191 million of pretax Data Breach-related
expenses and $46 million of expected insurance proceeds, for net expenses of $145 million. These expenses were
included in our Consolidated Statements of Operations as Selling, General and Administrative Expenses (SG&A), but
were not part of segment SG&A. Along with legal and other professional services, these expenses include an accrual
for estimated probable losses for what we believe to be the vast majority of actual and potential breach-related claims,
including claims by the payment card networks. Our probable loss estimate is based on the expectation of reaching
negotiated settlements, and not on any determination that it is probable we would be found liable for the losses we
have accrued were these claims to be litigated.
As of January 31, 2015 we have incurred $252 million of cumulative Data Breach-related expenses, partially offset by
$90 million of expected insurance recoveries, for net cumulative expenses of $162 million.
For more information about the Data Breach, see Note 17 of the Financial Statements.
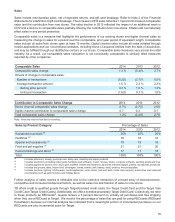
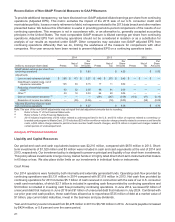
Analysis of Results of Operations
Segment Results
Percent Change
(dollars in millions) 2014 2013 2012 (a) 2014/2013 2013/2012
Sales $ 72,618 $ 71,279 $ 71,960 1.9 % (0.9)%
Cost of sales 51,278 50,039 50,568 2.5 (1.0)
Gross margin 21,340 21,240 21,392 0.5 (0.7)
SG&A expenses (b) 14,450 14,285 13,759 1.2 3.8
EBITDA 6,890 6,955 7,633 (0.9) (8.9)
Depreciation and amortization 2,129 1,996 2,044 6.7 (2.4)
EBIT $ 4,761 $ 4,959 $ 5,589 (4.0)% (11.3)%
Note: Effective January 15, 2015, we operate as a single segment which includes all of our continuing operations, excluding net interest
expense, data breach related costs and certain other expenses which are discretely managed. Our segment operations are designed to enable
guests to purchase products seamlessly in stores, online or through mobile devices. See Note 28 of our Financial Statements for a reconciliation
of our segment results to earnings before income taxes.
(a) Consisted of 53 weeks.
(b) SG&A includes credit card revenues and expenses for all periods presented prior to the March 2013 sale of our U.S. consumer credit
card portfolio to TD. For 2014 and 2013, SG&A also includes $682 million and $653 million, respectively, of profit-sharing income from
the arrangement with TD.
Rate Analysis 2014 2013 2012 (a)
Gross margin rate 29.4% 29.8% 29.7%
SG&A expense rate 19.9 20.0 19.1
EBITDA margin rate 9.5 9.8 10.6
Depreciation and amortization expense rate 2.9 2.8 2.8
EBIT margin rate 6.6 7.0 7.8
Note: Rate analysis metrics are computed by dividing the applicable amount by sales.
(a) Consisted of 53 weeks.
17