Target 2014 Annual Report Download - page 47
Download and view the complete annual report
Please find page 47 of the 2014 Target annual report below. You can navigate through the pages in the report by either clicking on the pages listed below, or by using the keyword search tool below to find specific information within the annual report.-
 1
1 -
2
-
3
-
4
-
5
-
6
-
7
-
8
-
9
-
10
-
11
-
12
-
13
-
14
-
15
-
16
-
17
-
18
-
19
-
20
-
21
-
22
-
23
-
24
-
25
-
26
-
27
-
28
-
29
-
30
-
31
-
32
-
33
-
34
-
35
-
36
-
 37
37 -
 38
38 -
 39
39 -
 40
40 -
 41
41 -
 42
42 -
 43
43 -
 44
44 -
 45
45 -
 46
46 -
 47
47 -
 48
48 -
 49
49 -
 50
50 -
 51
51 -
 52
52 -
 53
53 -
 54
54 -
 55
55 -
 56
56 -
 57
57 -
58
-
59
-
60
-
61
-
62
-
63
-
64
-
65
-
66
-
67
-
68
-
69
-
70
-
71
-
72
-
73
-
74
-
75
-
76
-
77
-
78
-
79
-
80
-
81
-
82
 |
 |
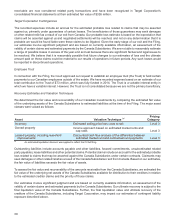
Valuation Technique
Short-term investments - Carrying value approximates fair value because maturities are less than three months.
Prepaid forward contracts - Initially valued at transaction price. Subsequently valued by reference to the market price
of Target common stock.
Interest rate swaps - Valuation models are calibrated to initial trade price. Subsequent valuations are based on
observable inputs to the valuation model (e.g., interest rates and credit spreads).
Company-owned life insurance investments - Includes investments in separate accounts that are valued based on
market rates credited by the insurer.
Beneficial interest asset - Valued using a cash-flow based economic-profit model, which includes inputs of the
forecasted performance of the receivables portfolio and a market-based discount rate. Internal data is used to
forecast expected payment patterns and write-offs, revenue, and operating expenses (credit EBIT yield) related to
the credit card portfolio. Changes in macroeconomic conditions in the United States could affect the estimated fair
value. A one percentage point change in the forecasted EBIT yield would impact our fair value estimate by
approximately $11 million. A one percentage point change in the forecasted discount rate would impact our fair
value estimate by approximately $2 million. As described in Note 7, this beneficial interest asset effectively
represents a receivable for the present value of future profit-sharing we expect to receive on the receivables sold.
As a result, a portion of the profit-sharing payments we receive from TD will reduce the beneficial interest asset.
As the asset is reduced over time, changes in the forecasted credit EBIT yield and the forecasted discount rate
will have a smaller impact on the estimated fair value.
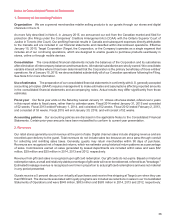
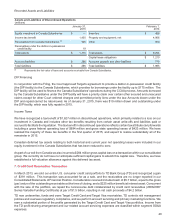
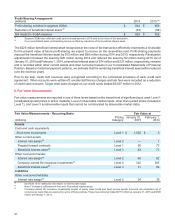
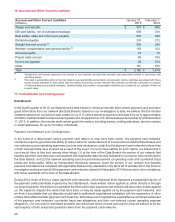
Significant Financial Instruments not Measured at Fair Value (a)
(millions) 2014
Carrying
Amount
Fair
Value
2013
Carrying
Amount
Fair
Value
Debt (b) $ 11,946 $ 14,089 $ 11,758 $ 13,184
(a) The
carrying amounts of certain other current assets, accounts payable, and certain accrued and other current liabilities approximate fair
value due to their short-term nature.
(b) The fair value of debt is generally measured using a discounted cash flow analysis based on current market interest rates for similar types
of financial instruments and would be classified as Level 2. These amounts exclude unamortized swap valuation adjustments and capital
lease obligations.
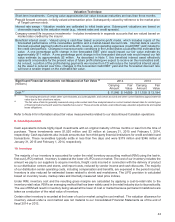
Refer to Note 6 for information about fair value measurements related to our discontinued Canadian operations.
9. Cash Equivalents
Cash equivalents include highly liquid investments with an original maturity of three months or less from the time of
purchase. These investments were $1,520 million and $3 million at January 31, 2015 and February 1, 2014,
respectively. Cash equivalents also include amounts due from third-party financial institutions for credit and debit card
transactions. These receivables typically settle in less than five days and were $379 million and $346 million at
January 31, 2015 and February 1, 2014, respectively.
10. Inventory
The majority of our inventory is accounted for under the retail inventory accounting method (RIM) using the last-in,
first-out (LIFO) method. Inventory is stated at the lower of LIFO cost or market. The cost of our inventory includes the
amount we pay to our suppliers to acquire inventory, freight costs incurred in connection with the delivery of product
to our distribution centers and stores, and import costs, reduced by vendor income and cash discounts. The majority
of our distribution center operating costs, including compensation and benefits, are expensed in the period incurred.
Inventory is also reduced for estimated losses related to shrink and markdowns. The LIFO provision is calculated
based on inventory levels, markup rates and internally measured retail price indices.
Under RIM, inventory cost and the resulting gross margins are calculated by applying a cost-to-retail ratio to the
inventory retail value. RIM is an averaging method that has been widely used in the retail industry due to its practicality.
The use of RIM will result in inventory being valued at the lower of cost or market because permanent markdowns are
taken as a reduction of the retail value of inventory.
Certain other inventory is recorded at the lower of cost or market using the cost method. The valuation allowance for
inventory valued under a cost method was not material to our Consolidated Financial Statements as of the end of
fiscal 2014 or 2013.
42