Target 2014 Annual Report Download - page 38
Download and view the complete annual report
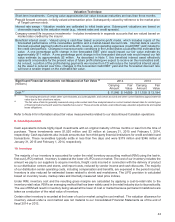
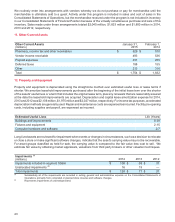
Please find page 38 of the 2014 Target annual report below. You can navigate through the pages in the report by either clicking on the pages listed below, or by using the keyword search tool below to find specific information within the annual report.-
 1
1 -
2
-
3
-
4
-
5
-
6
-
7
-
8
-
9
-
10
-
11
-
12
-
13
-
14
-
15
-
16
-
17
-
18
-
19
-
20
-
21
-
22
-
23
-
24
-
25
-
26
-
27
-
 28
28 -
 29
29 -
 30
30 -
 31
31 -
 32
32 -
 33
33 -
 34
34 -
 35
35 -
 36
36 -
 37
37 -
 38
38 -
 39
39 -
 40
40 -
 41
41 -
 42
42 -
 43
43 -
 44
44 -
 45
45 -
 46
46 -
 47
47 -
 48
48 -
49
-
50
-
51
-
52
-
53
-
54
-
55
-
56
-
57
-
58
-
59
-
60
-
61
-
62
-
63
-
64
-
65
-
66
-
67
-
68
-
69
-
70
-
71
-
72
-
73
-
74
-
75
-
76
-
77
-
78
-
79
-
80
-
81
-
82
 |
 |
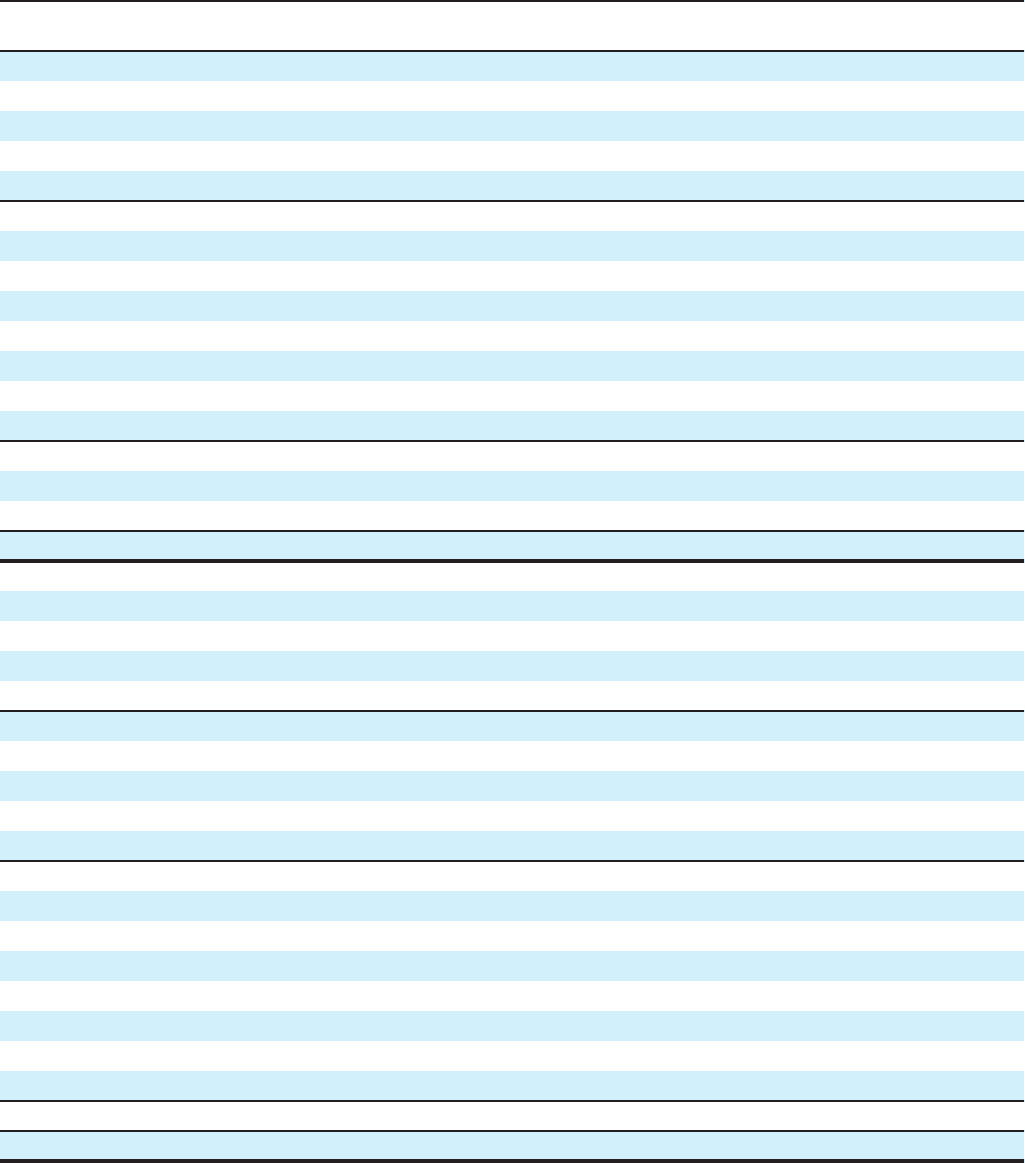
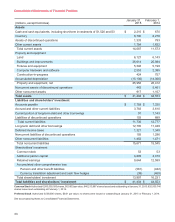
Consolidated Statements of Financial Position
(millions, except footnotes)
January 31,
2015
February 1,
2014
Assets
Cash and cash equivalents, including short-term investments of $1,520 and $3 $ 2,210 $ 670
Inventory 8,790 8,278
Assets of discontinued operations 1,333 793
Other current assets 1,754 1,832
Total current assets 14,087 11,573
Property and equipment
Land 6,127 6,143
Buildings and improvements 26,614 25,984
Fixtures and equipment 5,346 5,199
Computer hardware and software 2,553 2,395
Construction-in-progress 424 757
Accumulated depreciation (15,106) (14,066)
Property and equipment, net 25,958 26,412
Noncurrent assets of discontinued operations 442 5,461
Other noncurrent assets 917 1,107
Total assets $ 41,404 $ 44,553
Liabilities and shareholders' investment
Accounts payable $ 7,759 $ 7,335
Accrued and other current liabilities 3,783 3,610
Current portion of long-term debt and other borrowings 91 1,143
Liabilities of discontinued operations 103 689
Total current liabilities 11,736 12,777
Long-term debt and other borrowings 12,705 11,429
Deferred income taxes 1,321 1,349
Noncurrent liabilities of discontinued operations 193 1,296
Other noncurrent liabilities 1,452 1,471
Total noncurrent liabilities 15,671 15,545
Shareholders' investment
Common stock 53 53
Additional paid-in capital 4,899 4,470
Retained earnings 9,644 12,599
Accumulated other comprehensive loss
Pension and other benefit liabilities (561) (422)
Currency translation adjustment and cash flow hedges (38) (469)
Total shareholders' investment 13,997 16,231
Total liabilities and shareholders' investment $ 41,404 $ 44,553
Common Stock Authorized 6,000,000,000 shares, $0.0833 par value; 640,213,987 shares issued and outstanding at January 31, 2015; 632,930,740
shares issued and outstanding at February 1, 2014.
Preferred Stock Authorized 5,000,000 shares, $0.01 par value; no shares were issued or outstanding at January 31, 2015 or February 1, 2014.
See accompanying Notes to Consolidated Financial Statements.
33