Target 2014 Annual Report Download - page 63
Download and view the complete annual report
Please find page 63 of the 2014 Target annual report below. You can navigate through the pages in the report by either clicking on the pages listed below, or by using the keyword search tool below to find specific information within the annual report.-
 1
1 -
2
-
3
-
4
-
5
-
6
-
7
-
8
-
9
-
10
-
11
-
12
-
13
-
14
-
15
-
16
-
17
-
18
-
19
-
20
-
21
-
22
-
23
-
24
-
25
-
26
-
27
-
28
-
29
-
30
-
31
-
32
-
33
-
34
-
35
-
36
-
37
-
38
-
39
-
40
-
41
-
42
-
43
-
44
-
45
-
46
-
47
-
48
-
49
-
50
-
51
-
52
-
 53
53 -
 54
54 -
 55
55 -
 56
56 -
 57
57 -
 58
58 -
 59
59 -
 60
60 -
 61
61 -
 62
62 -
 63
63 -
 64
64 -
 65
65 -
 66
66 -
 67
67 -
 68
68 -
 69
69 -
 70
70 -
 71
71 -
 72
72 -
 73
73 -
74
-
75
-
76
-
77
-
78
-
79
-
80
-
81
-
82
 |
 |

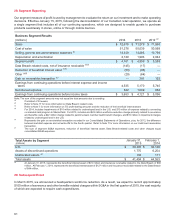
Defined Benefit Pension Plan Information
(millions) 2014 2013
Accumulated benefit obligation (ABO) for all plans (a) $ 3,834 $ 3,149
Projected benefit obligation for pension plans with an ABO in excess of plan assets (b) 65 54
Total ABO for pension plans with an ABO in excess of plan assets 56 48
(a) The present value of benefits earned to date assuming
no future salary growth.
(b) The present value of benefits earned to date by plan participants, including the effect of assumed future salary increases.
Assumptions
Benefit Obligation Weighted Average Assumptions
Pension Benefits
Postretirement
Health Care Benefits
2014 2013 2014 2013
Discount rate 3.87% 4.77% 2.74% 3.30%
Average assumed rate of compensation increase 3.00 3.00 n/a n/a
Net Periodic Benefit Expense Weighted Average
Assumptions Pension Benefits
Postretirement
Health Care Benefits
2014 2013 2012 2014 2013 2012
Discount rate 4.77% 4.40% 4.65% 3.30% 2.75% 3.60%
Expected long-term rate of return on plan assets 7.50 8.00 8.00 n/a n/a n/a
Average assumed rate of compensation increase 3.00 3.00 3.50 n/a n/a n/a
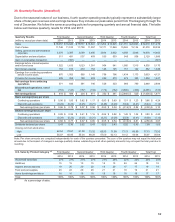
The weighted average assumptions used to measure net periodic benefit expense each year are the rates as of the
beginning of the year (i.e., the prior measurement date). Based on a stable asset allocation, our most recent compound
annual rate of return on qualified plans' assets was 12.1 percent, 8.3 percent, 7.0 percent and 9.7 percent for the 5-
year, 10-year, 15-year and 20-year time periods, respectively.
The market-related value of plan assets, which is used in calculating expected return on assets in net periodic benefit
cost, is determined each year by adjusting the previous year's value by expected return, benefit payments and cash
contributions. The market-related value is adjusted for asset gains and losses in equal 20 percent adjustments over
a five-year period.
We review the expected long-term rate of return annually, and revise it as appropriate. Additionally, we monitor the
mix of investments in our portfolio to ensure alignment with our long-term strategy to manage pension cost and reduce
volatility in our assets. Our expected annualized long-term rate of return assumptions as of January 31, 2015 were
8.0 percent for domestic and international equity securities, 5.0 percent for long-duration debt securities, 8.0 percent
for balanced funds and 9.5 percent for other investments. These estimates are a judgmental matter in which we
consider the composition of our asset portfolio, our historical long-term investment performance and current market
conditions.
An increase in the cost of covered health care benefits of 7.0 percent was assumed for 2014 and 7.0 percent is assumed
for 2015. The rate will be reduced to 5.0 percent in 2019 and thereafter.
Health Care Cost Trend Rates – 1% Change
(millions) 1% Increase 1% Decrease
Effect on total of service and interest cost components of net periodic postretirement
health care benefit expense $ 1 $ (1)
Effect on the health care component of the accumulated postretirement benefit
obligation 4 (4)
58