Target 2014 Annual Report Download - page 65
Download and view the complete annual report
Please find page 65 of the 2014 Target annual report below. You can navigate through the pages in the report by either clicking on the pages listed below, or by using the keyword search tool below to find specific information within the annual report.-
 1
1 -
2
-
3
-
4
-
5
-
6
-
7
-
8
-
9
-
10
-
11
-
12
-
13
-
14
-
15
-
16
-
17
-
18
-
19
-
20
-
21
-
22
-
23
-
24
-
25
-
26
-
27
-
28
-
29
-
30
-
31
-
32
-
33
-
34
-
35
-
36
-
37
-
38
-
39
-
40
-
41
-
42
-
43
-
44
-
45
-
46
-
47
-
48
-
49
-
50
-
51
-
52
-
53
-
54
-
 55
55 -
 56
56 -
 57
57 -
 58
58 -
 59
59 -
 60
60 -
 61
61 -
 62
62 -
 63
63 -
 64
64 -
 65
65 -
 66
66 -
 67
67 -
 68
68 -
 69
69 -
 70
70 -
 71
71 -
 72
72 -
 73
73 -
 74
74 -
 75
75 -
76
-
77
-
78
-
79
-
80
-
81
-
82
 |
 |

Position Valuation Technique
Cash and cash equivalents These investments are cash holdings and investment vehicles valued using the
Net Asset Value (NAV) provided by the administrator of the fund. The NAV for the
investment vehicles is based on the value of the underlying assets owned by the
fund minus applicable costs and liabilities, and then divided by the number of
shares outstanding.
Equity securities Valued at the closing price reported on the major market on which the individual
securities are traded.
Common collective trusts/
balanced funds/ certain
multi-strategy hedge funds
Valued using the NAV provided by the administrator of the fund. The NAV is a
quoted transactional price for participants in the fund, which do not represent an
active market.
Fixed income and government
securities
Valued using matrix pricing models and quoted prices of securities with similar
characteristics.
Private equity/ real estate/
certain multi-strategy hedge
funds/ other
Valued by deriving Target's proportionate share of equity investment from audited
financial statements. Private equity and real estate investments require
significant judgment on the part of the fund manager due to the absence of
quoted market prices, inherent lack of liquidity, and the long term of such
investments. Certain multi-strategy hedge funds represent funds of funds that
include liquidity restrictions and for which timely valuation information is not
available.
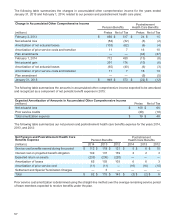
27. Accumulated Other Comprehensive Income
Currency Pension and
Cash Flow Translation Other
(millions) Hedges Adjustment Benefit Total
February 1, 2014 $ (25) $ (444) $ (422) $ (891)
Other comprehensive (loss)/income before
reclassifications — (302) (165) (467)
Amounts reclassified from AOCI 3 (a) 730 (b) 26 (c) 759
January 31, 2015 $ (22) $ (16) $ (561) $ (599)
(a) Represents
gains and losses on cash flow hedges, net of $2 million of taxes, which are recorded in net interest expense on the Consolidated
Statements of Operations.
(b) Represents Canadian accumulated currency translation adjustments deconsolidated on January 15, 2015. See Note 6 for additional
information.
(c) Represents amortization of pension and other benefit liabilities, net of $17 million of taxes, which is recorded in SG&A expenses on the
Consolidated Statements of Operations. See Note 26 for additional information.
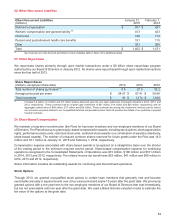
Contributions
Our obligations to plan participants can be met over time through a combination of company contributions to these
plans and earnings on plan assets. In 2014, we made a discretionary contribution of $150 million to our qualified
defined benefit pension plans. In 2013, we made no contributions. We are not required to make any contributions in
2015. However, depending on investment performance and plan funded status, we may elect to make a contribution.
We expect to make contributions in the range of $4 million to $5 million to our postretirement health care benefit plan
in 2015.
Estimated Future Benefit Payments
(millions)
Pension
Benefits
Postretirement
Health Care Benefits
2015 $ 161 $ 4
2016 170 5
2017 180 5
2018 189 6
2019 197 7
2020-2024 1,113 33
60