Target 2014 Annual Report Download - page 62
Download and view the complete annual report
Please find page 62 of the 2014 Target annual report below. You can navigate through the pages in the report by either clicking on the pages listed below, or by using the keyword search tool below to find specific information within the annual report.-
 1
1 -
2
-
3
-
4
-
5
-
6
-
7
-
8
-
9
-
10
-
11
-
12
-
13
-
14
-
15
-
16
-
17
-
18
-
19
-
20
-
21
-
22
-
23
-
24
-
25
-
26
-
27
-
28
-
29
-
30
-
31
-
32
-
33
-
34
-
35
-
36
-
37
-
38
-
39
-
40
-
41
-
42
-
43
-
44
-
45
-
46
-
47
-
48
-
49
-
50
-
51
-
 52
52 -
 53
53 -
 54
54 -
 55
55 -
 56
56 -
 57
57 -
 58
58 -
 59
59 -
 60
60 -
 61
61 -
 62
62 -
 63
63 -
 64
64 -
 65
65 -
 66
66 -
 67
67 -
 68
68 -
 69
69 -
 70
70 -
 71
71 -
 72
72 -
73
-
74
-
75
-
76
-
77
-
78
-
79
-
80
-
81
-
82
 |
 |

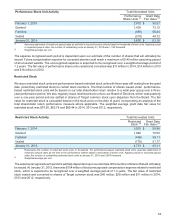
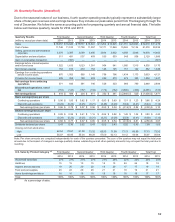
The following table summarizes the changes in accumulated other comprehensive income for the years ended
January 31, 2015 and February 1, 2014, related to our pension and postretirement health care plans:
Change in Accumulated Other Comprehensive Income
Pension Benefits
Postretirement
Health Care Benefits
(millions)
February 2, 2013
Net actuarial loss
Amortization of net actuarial losses
Amortization of prior service costs and transition
Plan amendments
February 1, 2014
Net actuarial gain
Amortization of net actuarial losses
Amortization of prior service costs and transition
Plan amendment
January 31, 2015
$
$
Pretax Net of Tax
856 $ 517
(52) (32)
(103) (62)
11 7
— —
712 430
291 176
(65) (40)
11 7
— —
949 $ 573
$
$
Pretax Net of Tax
24 $ 15
(3) (2)
(6) (4)
16 10
(44) (27)
(13) (8)
(10) (6)
(6) (3)
16 10
(9) (5)
(22) $ (12)
The following table summarizes the amounts in accumulated other comprehensive income expected to be amortized
and recognized as a component of net periodic benefit expense in 2015:
Expected Amortization of Amounts in Accumulated Other Comprehensive Income
(millions) Pretax Net of Tax
Net actuarial loss $ 108 $ 66
Prior service credits (29) (18)
Total amortization expense $ 79 $ 48
The following table summarizes our net pension and postretirement health care benefits expense for the years 2014,
2013, and 2012:
Net Pension and Postretirement Health Care
Benefits Expense Pension Benefits
Postretirement
Health Care Benefits
(millions)
Service cost benefits earned during the period
Interest cost on projected benefit obligation
Expected return on assets
Amortization of losses
$
2014
112 $
149
(233)
65
2013
118 $
137
(235)
103
2012
121
139
(220)
103
$
2014
5 $
2
—
6
2013
6 $
2
—
6
2012
10
3
—
3
Amortization of prior service cost
Settlement and Special Termination Charges
Total $
(11)
—
82 $
(11)
3
115 $
—
—
143 $
(16)
—
(3) $
(16)
—
(2) $
(10)
—
6
Prior service cost amortization is determined using the straight-line method over the average remaining service period
of team members expected to receive benefits under the plan.
57