Target 2014 Annual Report Download - page 40
Download and view the complete annual report
Please find page 40 of the 2014 Target annual report below. You can navigate through the pages in the report by either clicking on the pages listed below, or by using the keyword search tool below to find specific information within the annual report.-
 1
1 -
2
-
3
-
4
-
5
-
6
-
7
-
8
-
9
-
10
-
11
-
12
-
13
-
14
-
15
-
16
-
17
-
18
-
19
-
20
-
21
-
22
-
23
-
24
-
25
-
26
-
27
-
28
-
29
-
 30
30 -
 31
31 -
 32
32 -
 33
33 -
 34
34 -
 35
35 -
 36
36 -
 37
37 -
 38
38 -
 39
39 -
 40
40 -
 41
41 -
 42
42 -
 43
43 -
 44
44 -
 45
45 -
 46
46 -
 47
47 -
 48
48 -
 49
49 -
 50
50 -
51
-
52
-
53
-
54
-
55
-
56
-
57
-
58
-
59
-
60
-
61
-
62
-
63
-
64
-
65
-
66
-
67
-
68
-
69
-
70
-
71
-
72
-
73
-
74
-
75
-
76
-
77
-
78
-
79
-
80
-
81
-
82
 |
 |
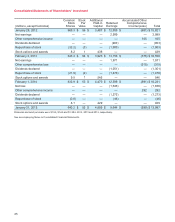
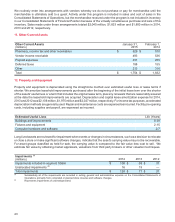
Consolidated Statements of Shareholders' Investment
(millions, except footnotes)
Common
Stock
Shares
Stock
Par
Value
Additional
Paid-in
Capital
Retained
Earnings
Accumulated Other
Comprehensive
Income/(Loss) Total
January 28, 2012 669.3 $ 56 $ 3,487 $ 12,959 $ (681) $ 15,821
Net earnings — — — 2,999 — 2,999
Other comprehensive income — — — — 105 105
Dividends declared — — — (903) — (903)
Repurchase of stock (32.2) (3) — (1,900) — (1,903)
Stock options and awards 8.2 1 438 — — 439
February 2, 2013 645.3 $ 54 $ 3,925 $ 13,155 $ (576) $ 16,558
Net earnings — — — 1,971 — 1,971
Other comprehensive loss — — — — (315) (315)
Dividends declared — — — (1,051) — (1,051)
Repurchase of stock (21.9) (2) — (1,476) — (1,478)
Stock options and awards 9.5 1 545 — — 546
February 1, 2014 632.9 $ 53 $ 4,470 $ 12,599 $ (891) $ 16,231
Net loss — — — (1,636) — (1,636)
Other comprehensive income — — — — 292 292
Dividends declared — — — (1,273) — (1,273)
Repurchase of stock (0.8) — — (46) — (46)
Stock options and awards 8.1 — 429 — — 429
January 31, 2015 640.2 $ 53 $ 4,899 $ 9,644 $ (599) $ 13,997
Dividends declared per share were $1.99, $1.65 and $1.38 in 2014, 2013 and 2012, respectively.
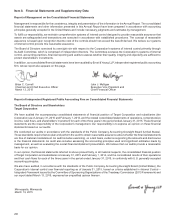
See accompanying Notes to Consolidated Financial Statements.
35