Target 2014 Annual Report Download - page 48
Download and view the complete annual report
Please find page 48 of the 2014 Target annual report below. You can navigate through the pages in the report by either clicking on the pages listed below, or by using the keyword search tool below to find specific information within the annual report.-
 1
1 -
2
-
3
-
4
-
5
-
6
-
7
-
8
-
9
-
10
-
11
-
12
-
13
-
14
-
15
-
16
-
17
-
18
-
19
-
20
-
21
-
22
-
23
-
24
-
25
-
26
-
27
-
28
-
29
-
30
-
31
-
32
-
33
-
34
-
35
-
36
-
37
-
 38
38 -
 39
39 -
 40
40 -
 41
41 -
 42
42 -
 43
43 -
 44
44 -
 45
45 -
 46
46 -
 47
47 -
 48
48 -
 49
49 -
 50
50 -
 51
51 -
 52
52 -
 53
53 -
 54
54 -
 55
55 -
 56
56 -
 57
57 -
 58
58 -
59
-
60
-
61
-
62
-
63
-
64
-
65
-
66
-
67
-
68
-
69
-
70
-
71
-
72
-
73
-
74
-
75
-
76
-
77
-
78
-
79
-
80
-
81
-
82
 |
 |
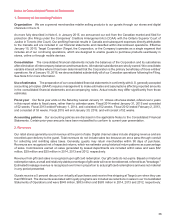
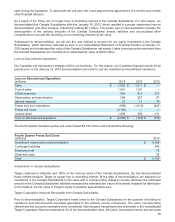
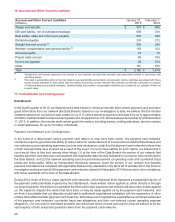
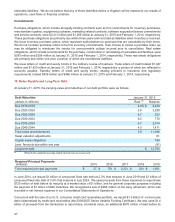
We routinely enter into arrangements with vendors whereby we do not purchase or pay for merchandise until the
merchandise is ultimately sold to a guest. Activity under this program is included in sales and cost of sales in the
Consolidated Statements of Operations, but the merchandise received under the program is not included in inventory
in our Consolidated Statements of Financial Position because of the virtually simultaneous purchase and sale of this
inventory. Sales made under these arrangements totaled $2,040 million, $1,833 million and $1,800 million in 2014,
2013 and 2012, respectively.
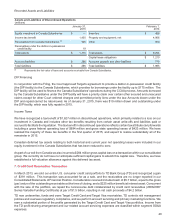
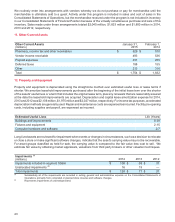
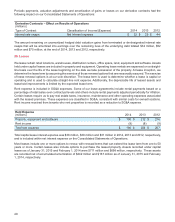
11. Other Current Assets
Other Current Assets
(millions)
January 31,
2015
February 1,
2014
Pharmacy, income tax and other receivables $ 629 $ 570
Vendor income receivable 493 536
Prepaid expenses 231 255
Deferred taxes 188 155
Other 213 316
Total $ 1,754 $ 1,832
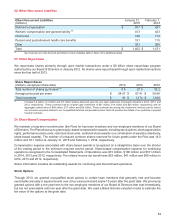
12. Property and Equipment
Property and equipment is depreciated using the straight-line method over estimated useful lives or lease terms if
shorter. We amortize leasehold improvements purchased after the beginning of the initial lease term over the shorter
of the assets' useful lives or a term that includes the original lease term, plus any renewals that are reasonably assured
at the date the leasehold improvements are acquired. Depreciation and capital lease amortization expense for 2014,
2013 and 2012 was $2,108 million, $1,975 million and $2,027 million, respectively. For income tax purposes, accelerated
depreciation methods are generally used. Repair and maintenance costs are expensed as incurred. Facility pre-opening
costs, including supplies and payroll, are expensed as incurred.
Estimated Useful Lives Life (Years)
Buildings and improvements 8-39
Fixtures and equipment 2-15
Computer hardware and software 2-7
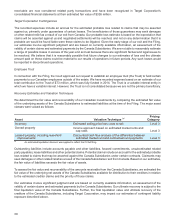
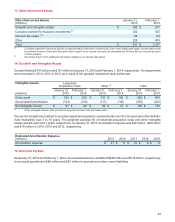
Long-lived assets are reviewed for impairment when events or changes in circumstances, such as a decision to relocate
or close a store or make significant software changes, indicate that the asset's carrying value may not be recoverable.
For asset groups classified as held for sale, the carrying value is compared to the fair value less cost to sell. We
estimate fair value by obtaining market appraisals, valuations from third party brokers or other valuation techniques.
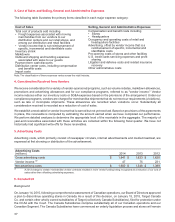
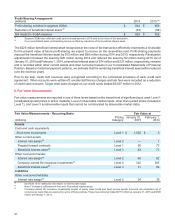
Impairments (a)
(millions) 2014 2013 2012
Impairments included in segment SG&A $ 108 $ 58 $ 37
Unallocated impairments (b) 16 19 —
Total impairments $ 124 $ 77 $ 37
(a) Substantially all of the impairments are recorded in selling, general and administrative expense on the Consolidated Statements of
Operations, primarily from completed or planned store closures and software changes.
(b)
Represents impairments
of undeveloped land.
43