Target 2014 Annual Report Download - page 20
Download and view the complete annual report
Please find page 20 of the 2014 Target annual report below. You can navigate through the pages in the report by either clicking on the pages listed below, or by using the keyword search tool below to find specific information within the annual report.-
 1
1 -
2
-
3
-
4
-
5
-
6
-
7
-
8
-
9
-
 10
10 -
 11
11 -
 12
12 -
 13
13 -
 14
14 -
 15
15 -
 16
16 -
 17
17 -
 18
18 -
 19
19 -
 20
20 -
 21
21 -
 22
22 -
 23
23 -
 24
24 -
 25
25 -
 26
26 -
 27
27 -
 28
28 -
 29
29 -
 30
30 -
31
-
32
-
33
-
34
-
35
-
36
-
37
-
38
-
39
-
40
-
41
-
42
-
43
-
44
-
45
-
46
-
47
-
48
-
49
-
50
-
51
-
52
-
53
-
54
-
55
-
56
-
57
-
58
-
59
-
60
-
61
-
62
-
63
-
64
-
65
-
66
-
67
-
68
-
69
-
70
-
71
-
72
-
73
-
74
-
75
-
76
-
77
-
78
-
79
-
80
-
81
-
82
 |
 |

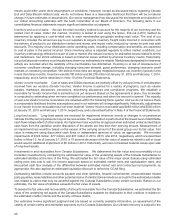
Item 6. Selected Financial Data
(millions, except per share data)
As of or for the Fiscal Year Ended
2014
2013 2012 (a) 2011 2010 2009
Total revenues (b) $ 72,618 $ 71,279 $ 73,301 $ 69,865 $ 67,390 $ 65,357
Net (Loss)/Earnings
Continuing operations 2,449 2,694 3,315 3,049 2,920 2,488
Discontinued operations (4,085) (723) (316) (120) — —
Net (loss)/earnings (1,636) 1,971 2,999 2,929 2,920 2,488
Basic (Loss)/Earnings Per Share
Continuing operations 3.86 4.24 5.05 4.49 4.03 3.31
Discontinued operations (6.44) (1.14) (0.48) (0.18) — —
Basic (loss)/earnings per share (2.58) 3.10 4.57 4.31 4.03 3.31
Diluted (Loss)/Earnings Per Share
Continuing operations 3.83 4.20 5.00 4.46 4.00 3.30
Discontinued operations (6.38) (1.13) (0.48) (0.18) — —
Diluted (loss)/earnings per share (2.56) 3.07 4.52 4.28 4.00 3.30
Cash dividends declared per share 1.99 1.65 1.38 1.15 0.92 0.67
Total assets 41,404 44,553 48,163 46,630 43,705 44,533
Long-term debt, including current portion 12,796 12,572 16,359 16,225 15,726 16,814
Note: This information should be read in conjunction with MD&A and the Financial Statements.
(a) Consisted of 53 weeks.
(b) For 2014 and 2013, total revenues include sales generated by our retail operations. For 2012 and prior, total revenues include sales
generated by our retail operations and credit card revenues.
Item 7. Management's Discussion and Analysis of Financial Condition and Results of Operations
Executive Summary
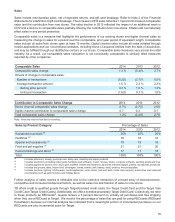
Fiscal 2014 included the following notable items:
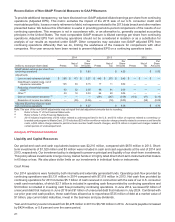
• GAAP earnings per share were $(2.56), including dilution of $(6.38) related to discontinued operations.
• Adjusted earnings per share from continuing operations were $4.27.
• Comparable sales grew 1.3 percent. Digital channel sales growth of more than 30 percent contributed 0.7
percentage points to 2014 comparable sales growth.
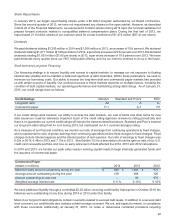
• We paid dividends of $1,205 million in 2014, an increase of 19.8 percent above 2013.
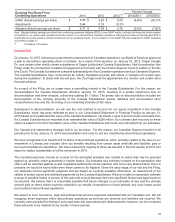
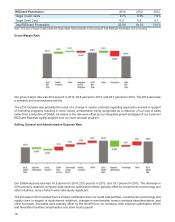
Sales from continuing operations were $72,618 million for 2014, an increase of $1,339 million or 1.9 percent from the
prior year. Earnings from continuing operations before interest expense and income taxes in 2014 decreased by $636
million or 12.3 percent from 2013 to $4,535 million. Cash flow provided by continuing operations was $5,131 million,
$7,519 million, and $5,568 million for 2014, 2013, and 2012, respectively. In connection with the sale of our U.S. credit
card receivables, we received cash of $5.7 billion during 2013. Of this amount, $2.7 billion is included in operating
cash flow provided by continuing operations and $3.0 billion is included in investing cash flow provided by continuing
operations.
15