Target 2014 Annual Report Download - page 58
Download and view the complete annual report
Please find page 58 of the 2014 Target annual report below. You can navigate through the pages in the report by either clicking on the pages listed below, or by using the keyword search tool below to find specific information within the annual report.-
 1
1 -
2
-
3
-
4
-
5
-
6
-
7
-
8
-
9
-
10
-
11
-
12
-
13
-
14
-
15
-
16
-
17
-
18
-
19
-
20
-
21
-
22
-
23
-
24
-
25
-
26
-
27
-
28
-
29
-
30
-
31
-
32
-
33
-
34
-
35
-
36
-
37
-
38
-
39
-
40
-
41
-
42
-
43
-
44
-
45
-
46
-
47
-
 48
48 -
 49
49 -
 50
50 -
 51
51 -
 52
52 -
 53
53 -
 54
54 -
 55
55 -
 56
56 -
 57
57 -
 58
58 -
 59
59 -
 60
60 -
 61
61 -
 62
62 -
 63
63 -
 64
64 -
 65
65 -
 66
66 -
 67
67 -
 68
68 -
69
-
70
-
71
-
72
-
73
-
74
-
75
-
76
-
77
-
78
-
79
-
80
-
81
-
82
 |
 |
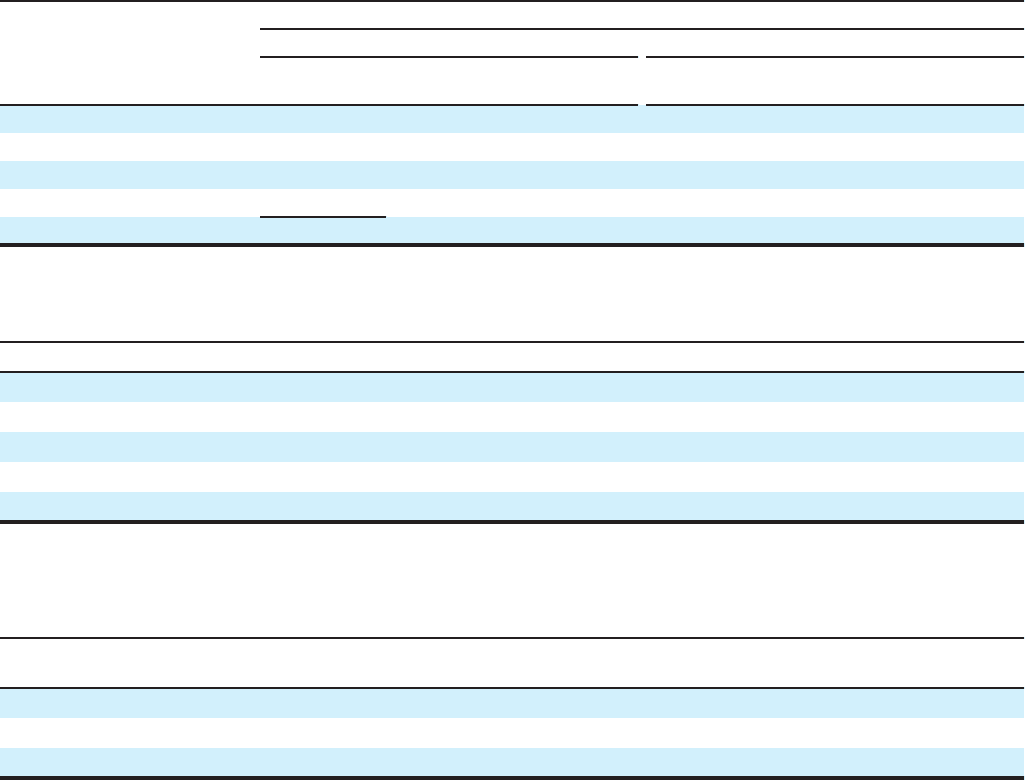
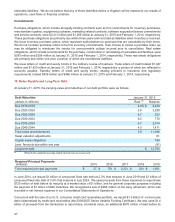
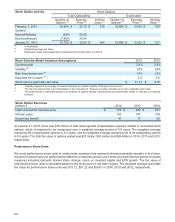
Stock Option Activity Stock Options
Total Outstanding Exercisable
Number of Exercise Intrinsic Number of Exercise Intrinsic
Options (a) Price (b) Value (c) Options (a) Price (b) Value (c)
February 1, 2014 24,854 $ 52.19 $ 136 16,824 $ 50.64 $ 109
Granted — —
Expired/forfeited (634) 55.05
Exercised/issued (7,495) 50.04
January 31, 2015 16,725 $ 53.04 $ 344 12,843 $ 52.02 $ 277
(a) In thousands.
(b) Weighted average per share.
(c) Represents stock price appreciation subsequent to the grant date, in millions.
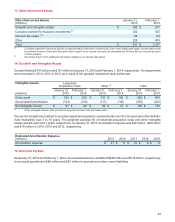
Black-Scholes Model Valuation Assumptions 2013 2012
Dividend yield 2.4% 2.4%
Volatility (a) 22% 23%
Risk-free interest rate (b) 1.4% 1.0%
Expected life in years (c) 5.5 5.5
Stock options grant date fair value $ 11.14 $ 9.70
(a) Volatility
represents an average of market estimates for implied volatility of Target common stock.
(b) The risk-free interest rate is an interpolation of the relevant U.S. Treasury security maturities as of each applicable grant date.
(c) The expected life is estimated based on an analysis of options already exercised and any foreseeable trends or changes in recipients'
behavior.
Stock Option Exercises
(millions) 2014 2013 2012
Cash received for exercise price $ 374 $ 422 $ 331
Intrinsic value 143 197 139
Income tax benefit 41 77 55
At January 31, 2015, there was $15 million of total unrecognized compensation expense related to nonvested stock
options, which is expected to be recognized over a weighted average period of 0.8 years. The weighted average
remaining life of exercisable options is 5.0 years, and the weighted average remaining life of all outstanding options
is 5.5 years. The total fair value of options vested was $37 million, $53 million and $68 million in 2014, 2013 and 2012,
respectively.
Performance Share Units
We issue performance share units to certain team members that represent shares potentially issuable in the future.
Issuance is based upon our performance relative to a retail peer group over a three-year performance period on certain
measures including domestic market share change, return on invested capital and EPS growth. The fair value of
performance share units is calculated based on the stock price on the date of grant. The weighted average grant date
fair value for performance share units was $73.12, $57.22 and $58.61 in 2014, 2013 and 2012, respectively.
53