Toyota 2007 Annual Report Download - page 104
Download and view the complete annual report
Please find page 104 of the 2007 Toyota annual report below. You can navigate through the pages in the report by either clicking on the pages listed below, or by using the keyword search tool below to find specific information within the annual report.-
 1
1 -
2
-
3
-
4
-
5
-
6
-
7
-
8
-
9
-
10
-
11
-
12
-
13
-
14
-
15
-
16
-
17
-
18
-
19
-
20
-
21
-
22
-
23
-
24
-
25
-
26
-
27
-
28
-
29
-
30
-
31
-
32
-
33
-
34
-
35
-
36
-
37
-
38
-
39
-
40
-
41
-
42
-
43
-
44
-
45
-
46
-
47
-
48
-
49
-
50
-
51
-
52
-
53
-
54
-
55
-
56
-
57
-
58
-
59
-
60
-
61
-
62
-
63
-
64
-
65
-
66
-
67
-
68
-
69
-
70
-
71
-
72
-
73
-
74
-
75
-
76
-
77
-
78
-
79
-
80
-
81
-
82
-
83
-
84
-
85
-
86
-
87
-
88
-
89
-
90
-
91
-
92
-
93
-
 94
94 -
 95
95 -
 96
96 -
 97
97 -
 98
98 -
 99
99 -
 100
100 -
 101
101 -
 102
102 -
 103
103 -
 104
104 -
 105
105 -
 106
106 -
 107
107 -
 108
108 -
 109
109 -
 110
110 -
 111
111 -
 112
112 -
 113
113 -
 114
114 -
115
-
116
-
117
-
118
-
119
-
120
-
121
-
122
-
123
-
124
-
125
-
126
-
127
-
128
-
129
-
130
-
131
-
132
-
133
-
134
-
135
-
136
-
137
-
138
-
139
-
140
 |
 |

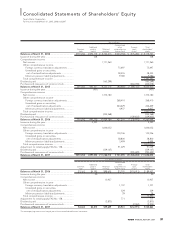
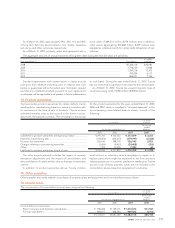
Other comprehensive income—
Other comprehensive income refers to revenues, expenses,
gains and losses that, under accounting principles generally
accepted in the United States of America are included in com-
prehensive income, but are excluded from net income as these
amounts are recorded directly as an adjustment to sharehold-
ers’ equity. Toyota’s other comprehensive income is primarily
comprised of unrealized gains/losses on marketable securities
designated as available-for-sale, foreign currency translation
adjustments and adjustments attributed to minimum pension
liabilities associated with Toyota’s defined benefit pension
plans.
Accounting changes—
In November 2004, the Financial Accounting Standard Board
(“FASB”) issued FAS No. 151, Inventory Costs – an amendment
of ARB No. 43, Chapter 4 (“FAS 151”). FAS 151 amends the
guidance in Accounting Research Bulletin (“ARB”) No. 43,
Chapter 4 (“ARB 43, Chapter 4”), Inventory Pricing, to clarify the
accounting for abnormal amounts of idle facility expense,
freight, handling costs, and wasted material (spoilage).
Paragraph 5 of ARB 43, Chapter 4, previously stated that “. . .
under some circumstances, items such as idle facility expense,
excessive spoilage, double freight, and rehandling costs may
be so abnormal as to require treatment as current period
charges. . . .” FAS 151 requires that those items be recognized
as current-period charges regardless of whether they meet the
criterion of “so abnormal.” In addition, this Statement requires
that allocation of fixed production overheads to the costs of
conversion be based on the normal capacity of the production
facilities. Toyota adopted FAS 151 effective for inventory costs
incurred during fiscal year begun after June 15, 2005. The adop-
tion of FAS 151 did not have material impact on Toyota’s con-
solidated financial statements.
In December 2004, FASB issued FAS 123(R). FAS 123(R) is a
revision of FAS 123 and supersedes APB 25 and its related
implementation guidance. FAS 123(R) requires a public entity to
measure the cost of employee services received in exchange for
an award of equity instruments based on the grant-date fair
value of the award. That cost will be recognized over the period
during which an employee is required to provide service in
exchange for the award. FAS 123(R) also requires a public entity
102 ANNUAL REPORT 2007
Net income per share—
Basic net income per common share is calculated by dividing
net income by the weighted-average number of shares out-
standing during the reported period. The calculation of diluted
net income per common share is similar to the calculation of
basic net income per share, except that the weighted-average
number of shares outstanding includes the additional dilution
from the assumed exercise of dilutive stock options.
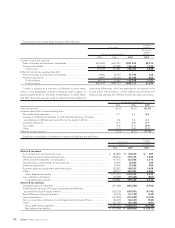
Stock-based compensation—
Toyota measures compensation expense for its stock-based
compensation plan based on the grant-date fair value of the
award from the fiscal year beginning on April 1, 2006. Toyota
accounts for the stock-based compensation plans in accordance
with FAS No. 123(R), Share – Based Payment (revised 2004)
(“FAS 123(R)”).
Prior to the adoption of FAS 123(R), Toyota measured com-
pensation expense using the intrinsic value method under the
recognition and measurement principles of the Accounting
Principles Board (“APB”) Opinion No. 25 (“APB 25”), Accounting
for Stock Issued to Employees, and related Interpretations. No
stock-based compensation expense was reflected in net
income, as all options granted under Toyota’s stock-based
compensation plan had an exercise price higher than the mar-
ket value of the underlying common stock on the date of grant.
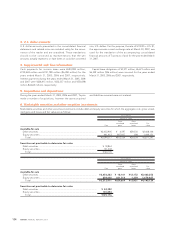
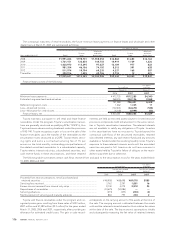
The following table illustrates the effect on net income and
earnings per share for the prior years to the adoption of FAS
123(R) that ended March 31, 2005 and 2006, if the company had
applied the fair value recognition provisions of FAS No. 123,
Accounting for Stock-Based Compensation (“FAS 123”), to
stock-based employee compensation. See note 18 to the con-
solidated financial statements for weighted-average assump-
tions used in option pricing model.
Yen in millions
For the years ended March 31,
2005 2006
Net income
As reported............................................................................................................................................... ¥1,171,260 ¥1,372,180
Deduct: Total stock-based compensation expenses determined
under fair value based method for all awards, net of related tax effects...................................... (1,571) (1,449)
Pro forma .................................................................................................................................................. ¥1,169,689 ¥1,370,731
Net income per share
—Basic As reported............................................................................................................. ¥355.35 ¥421.76
Pro forma ................................................................................................................ 354.87 421.32
—Diluted As reported.............................................................................................................¥355.28 ¥421.62
Pro forma ................................................................................................................ 354.80 421.18