Toyota 2007 Annual Report Download - page 131
Download and view the complete annual report
Please find page 131 of the 2007 Toyota annual report below. You can navigate through the pages in the report by either clicking on the pages listed below, or by using the keyword search tool below to find specific information within the annual report.-
 1
1 -
2
-
3
-
4
-
5
-
6
-
7
-
8
-
9
-
10
-
11
-
12
-
13
-
14
-
15
-
16
-
17
-
18
-
19
-
20
-
21
-
22
-
23
-
24
-
25
-
26
-
27
-
28
-
29
-
30
-
31
-
32
-
33
-
34
-
35
-
36
-
37
-
38
-
39
-
40
-
41
-
42
-
43
-
44
-
45
-
46
-
47
-
48
-
49
-
50
-
51
-
52
-
53
-
54
-
55
-
56
-
57
-
58
-
59
-
60
-
61
-
62
-
63
-
64
-
65
-
66
-
67
-
68
-
69
-
70
-
71
-
72
-
73
-
74
-
75
-
76
-
77
-
78
-
79
-
80
-
81
-
82
-
83
-
84
-
85
-
86
-
87
-
88
-
89
-
90
-
91
-
92
-
93
-
94
-
95
-
96
-
97
-
98
-
99
-
100
-
101
-
102
-
103
-
104
-
105
-
106
-
107
-
108
-
109
-
110
-
111
-
112
-
113
-
114
-
115
-
116
-
117
-
118
-
119
-
120
-
 121
121 -
 122
122 -
 123
123 -
 124
124 -
 125
125 -
 126
126 -
 127
127 -
 128
128 -
 129
129 -
 130
130 -
 131
131 -
 132
132 -
 133
133 -
 134
134 -
 135
135 -
 136
136 -
 137
137 -
 138
138 -
 139
139 -
 140
140
 |
 |

ANNUAL REPORT 2007 129
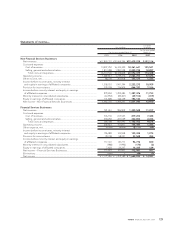
Statements of income—
U.S. dollars
Yen in millions in millions
For the year ended
For the years ended March 31, March 31,
2005 2006 2007 2007
Non-Financial Services Businesses
Net revenues .................................................................................................... ¥17,800,357 ¥20,068,284 ¥22,679,078 $192,114
Costs and expenses
Cost of revenues .......................................................................................... 14,497,252 16,335,340 18,361,641 155,541
Selling, general and administrative............................................................ 1,813,288 1,993,528 2,230,734 18,897
Total costs and expenses........................................................................ 16,310,540 18,328,868 20,592,375 174,438
Operating income............................................................................................ 1,489,817 1,739,416 2,086,703 17,676
Other income, net............................................................................................ 68,736 201,978 145,570 1,233
Income before income taxes, minority interest
and equity in earnings of affiliated companies ........................................... 1,558,553 1,941,394 2,232,273 18,909
Provision for income taxes .............................................................................. 578,709 736,909 844,797 7,156
Income before minority interest and equity in earnings
of affiliated companies .................................................................................. 979,844 1,204,485 1,387,476 11,753
Minority interest in consolidated subsidiaries............................................... (63,952) (82,401) (49,513) (419)
Equity in earnings of affiliated companies..................................................... 131,849 142,139 193,130 1,636
Net income – Non-Financial Services Businesses......................................... 1,047,741 1,264,223 1,531,093 12,970
Financial Services Businesses
Net revenues .................................................................................................... 781,261 996,909 1,300,548 11,017
Costs and expenses
Cost of revenues .......................................................................................... 376,150 613,563 879,203 7,448
Selling, general and administrative............................................................ 204,258 227,529 262,850 2,226
Total costs and expenses........................................................................ 580,408 841,092 1,142,053 9,674
Operating income............................................................................................ 200,853 155,817 158,495 1,343
Other expense, net.......................................................................................... (4,764) (9,859) (8,171) (69)
Income before income taxes, minority interest
and equity in earnings of affiliated companies ........................................... 196,089 145,958 150,324 1,274
Provision for income taxes .............................................................................. 78,748 58,241 53,548 454
Income before minority interest and equity in earnings
of affiliated companies .................................................................................. 117,341 87,717 96,776 820
Minority interest in consolidated subsidiaries............................................... (988) (1,992) (174) (2)
Equity in earnings of affiliated companies..................................................... 7,622 22,227 16,385 139
Net income – Financial Services Businesses.................................................. 123,975 107,952 112,987 957
Eliminations ...................................................................................................... (456) 5 (48) (0)
Net income....................................................................................................... ¥ 1,171,260 ¥ 1,372,180 ¥ 1,644,032 $ 13,927