Toyota 2007 Annual Report Download - page 106
Download and view the complete annual report
Please find page 106 of the 2007 Toyota annual report below. You can navigate through the pages in the report by either clicking on the pages listed below, or by using the keyword search tool below to find specific information within the annual report.-
 1
1 -
2
-
3
-
4
-
5
-
6
-
7
-
8
-
9
-
10
-
11
-
12
-
13
-
14
-
15
-
16
-
17
-
18
-
19
-
20
-
21
-
22
-
23
-
24
-
25
-
26
-
27
-
28
-
29
-
30
-
31
-
32
-
33
-
34
-
35
-
36
-
37
-
38
-
39
-
40
-
41
-
42
-
43
-
44
-
45
-
46
-
47
-
48
-
49
-
50
-
51
-
52
-
53
-
54
-
55
-
56
-
57
-
58
-
59
-
60
-
61
-
62
-
63
-
64
-
65
-
66
-
67
-
68
-
69
-
70
-
71
-
72
-
73
-
74
-
75
-
76
-
77
-
78
-
79
-
80
-
81
-
82
-
83
-
84
-
85
-
86
-
87
-
88
-
89
-
90
-
91
-
92
-
93
-
94
-
95
-
 96
96 -
 97
97 -
 98
98 -
 99
99 -
 100
100 -
 101
101 -
 102
102 -
 103
103 -
 104
104 -
 105
105 -
 106
106 -
 107
107 -
 108
108 -
 109
109 -
 110
110 -
 111
111 -
 112
112 -
 113
113 -
 114
114 -
 115
115 -
 116
116 -
117
-
118
-
119
-
120
-
121
-
122
-
123
-
124
-
125
-
126
-
127
-
128
-
129
-
130
-
131
-
132
-
133
-
134
-
135
-
136
-
137
-
138
-
139
-
140
 |
 |
104 ANNUAL REPORT 2007
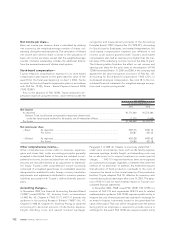
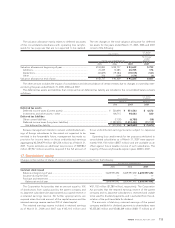
U.S. dollar amounts presented in the consolidated financial
statements and related notes are included solely for the conve-
nience of the reader and are unaudited. These translations
should not be construed as representations that the yen
amounts actually represent, or have been or could be converted
into, U.S. dollars. For this purpose, the rate of ¥118.05 = U.S. $1,
the approximate current exchange rate at March 30, 2007, was
used for the translation of the accompanying consolidated
financial amounts of Toyota as of and for the year ended March
31, 2007.
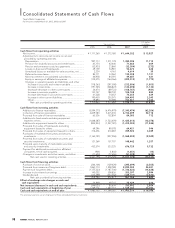
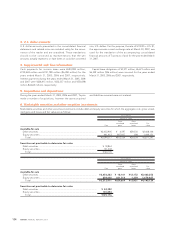
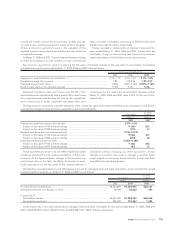
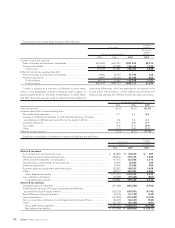
3. U.S. dollar amounts:
Cash payments for income taxes were ¥694,985 million,
¥730,469 million and ¥741,798 million ($6,284 million) for the
years ended March 31, 2005, 2006 and 2007, respectively.
Interest payments during the years ended March 31, 2005, 2006
and 2007 were ¥226,615 million, ¥332,337 million and ¥550,398
million ($4,662 million), respectively.
Capital lease obligations of ¥3,571 million, ¥6,673 million and
¥6,559 million ($56 million) were incurred for the years ended
March 31, 2005, 2006 and 2007, respectively.
4. Supplemental cash flow information:
During the years ended March 31, 2005, 2006 and 2007, Toyota
made a number of acquisitions, however the assets acquired
and liabilities assumed were not material.
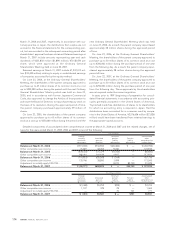
5. Acquisitions and dispositions:
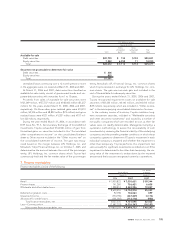
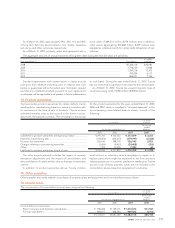
Marketable securities and other securities investments include debt and equity securities for which the aggregate cost, gross unreal-
ized gains and losses and fair value are as follows:
Yen in millions
March 31, 2006
Gross Gross
unrealized unrealized Fair
Cost gains` losses value
Available-for-sale
Debt securities ................................................................................................. ¥2,432,905 ¥ 4,597 ¥29,356 ¥2,408,146
Equity securities ............................................................................................... 661,412 807,937 198 1,469,151
Total .............................................................................................................. ¥3,094,317 ¥812,534 ¥29,554 ¥3,877,297
Securities not practicable to determine fair value
Debt securities ................................................................................................. ¥ 18,863
Equity securities ............................................................................................... 141,242
Total .............................................................................................................. ¥160,105
Yen in millions
March 31, 2007
Gross Gross
unrealized unrealized Fair
Cost gains` losses value
Available-for-sale
Debt securities ................................................................................................. ¥2,454,283 ¥ 18,141 ¥12,172 ¥2,460,252
Equity securities ............................................................................................... 859,628 821,518 1,259 1,679,887
Total .............................................................................................................. ¥3,313,911 ¥839,659 ¥13,431 ¥4,140,139
Securities not practicable to determine fair value
Debt securities ................................................................................................. ¥ 24,322
Equity securities ............................................................................................... 100,854
Total .............................................................................................................. ¥125,176
6. Marketable securities and other securities investments: