Toyota 2007 Annual Report Download - page 80
Download and view the complete annual report
Please find page 80 of the 2007 Toyota annual report below. You can navigate through the pages in the report by either clicking on the pages listed below, or by using the keyword search tool below to find specific information within the annual report.-
 1
1 -
2
-
3
-
4
-
5
-
6
-
7
-
8
-
9
-
10
-
11
-
12
-
13
-
14
-
15
-
16
-
17
-
18
-
19
-
20
-
21
-
22
-
23
-
24
-
25
-
26
-
27
-
28
-
29
-
30
-
31
-
32
-
33
-
34
-
35
-
36
-
37
-
38
-
39
-
40
-
41
-
42
-
43
-
44
-
45
-
46
-
47
-
48
-
49
-
50
-
51
-
52
-
53
-
54
-
55
-
56
-
57
-
58
-
59
-
60
-
61
-
62
-
63
-
64
-
65
-
66
-
67
-
68
-
69
-
 70
70 -
 71
71 -
 72
72 -
 73
73 -
 74
74 -
 75
75 -
 76
76 -
 77
77 -
 78
78 -
 79
79 -
 80
80 -
 81
81 -
 82
82 -
 83
83 -
 84
84 -
 85
85 -
 86
86 -
 87
87 -
 88
88 -
 89
89 -
 90
90 -
91
-
92
-
93
-
94
-
95
-
96
-
97
-
98
-
99
-
100
-
101
-
102
-
103
-
104
-
105
-
106
-
107
-
108
-
109
-
110
-
111
-
112
-
113
-
114
-
115
-
116
-
117
-
118
-
119
-
120
-
121
-
122
-
123
-
124
-
125
-
126
-
127
-
128
-
129
-
130
-
131
-
132
-
133
-
134
-
135
-
136
-
137
-
138
-
139
-
140
 |
 |
78 ANNUAL REPORT 2007
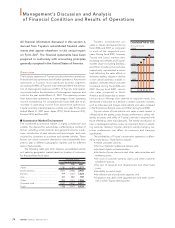
■Segmentation
Toyota’s most significant business segment is its automotive
operations. Toyota carries out its automotive operations as a
global competitor in the worldwide automotive market.
Management allocates resources to, and assesses the perfor-
mance of, its automotive operations as a single business seg-
ment on a worldwide basis. Toyota does not manage any subset
of its automotive operations, such as domestic or overseas oper-
ations or parts, as separate management units.
The management of the automotive operations is aligned on
a functional basis with managers having oversight responsibility
for the major operating functions within the segment.
Management assesses financial and non-financial data such as
units of sale, units of production, market share information, vehi-
cle model plans and plant location costs to allocate resources
within the automotive operations.
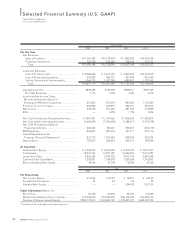
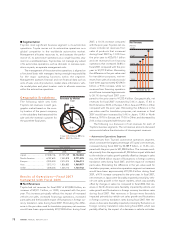
Geographic Breakdown
The following table sets forth
Toyota’s net revenues in each geo-
graphic market based on the coun-
try location of the parent company
or the subsidiary that transacted the
sale with the external customer for
the past three fiscal years.
Yen in millions
For the years ended March 31,
2005 2006 2007
Japan............................... ¥7,408,136 ¥7,735,109 ¥8,152,884
North America................ 6,187,624 7,455,818 8,771,495
Europe ............................ 2,305,450 2,574,014 3,346,013
Asia.................................. 1,572,113 1,836,855 1,969,957
Other............................... 1,078,203 1,435,113 1,707,742
Results of Operations—Fiscal 2007
Compared with Fiscal 2006
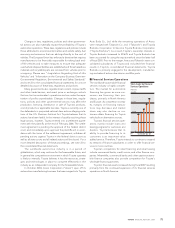
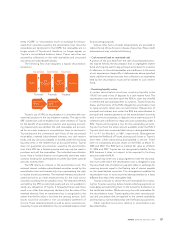
■Net Revenues
Toyota had net revenues for fiscal 2007 of ¥23,948.0 billion, an
increase of ¥2,911.1 billion, or 13.8%, compared with the prior
year. This increase principally reflects the impact of increased
vehicle unit sales, increased financings operations, increased
parts sales and the favorable impact of fluctuations in foreign cur-
rency translation rates during fiscal 2007. Eliminating the differ-
ence in the yen value used for translation purposes, net revenues
would have been approximately ¥23,195.8 billion during fiscal
2007, a 10.3% increase compared
with the prior year. Toyota’s net rev-
enues include net revenues from
sales of products that increased
during fiscal 2007 by 13.0% from
the prior year to ¥22,670.1 billion
and net revenues from financing
operations that increased 30.8% in
fiscal 2007 compared with the prior
year to ¥1,277.9 billion. Eliminating
the difference in the yen value used
for translation purposes, net rev-
enues from sales of products would
have been approximately ¥21,963.4
billion, a 9.5% increase, while net
revenues from financing operations
would have increased approximate-
ly 26.1% during fiscal 2007 com-
pared to the prior year to ¥1,232.4 billion. Geographically, net
revenues for fiscal 2007 increased by 5.4% in Japan, 17.6% in
North America, 30.0% in Europe, 7.2% in Asia and 19.0% in Other
compared with the prior year. Eliminating the difference in the
yen value used for translation purposes, net revenues in fiscal
2007 would have increased by 5.4% in Japan, 13.9% in North
America, 19.7% in Europe, and 17.0% in Other, and decreased by
2.4% in Asia compared with the prior year.
The following is a discussion of net revenues for each of
Toyota’s business segments. The net revenue amounts discussed
are amounts before the elimination of intersegment revenues.
• Automotive Operations Segment
Net revenues from Toyota’s automotive operations segment,
which constitute the largest percentage of Toyota’s net revenues,
increased during fiscal 2007 by ¥2,589.9 billion, or 13.4% com-
pared with the prior year to ¥21,928.0 billion. The increase result-
ed primarily from the approximate ¥1,200 billion impact attributed
to the vehicle unit sales growth partially offset by changes in sales
mix, the ¥704.6 billion impact of fluctuations in foreign currency
translation rates during fiscal 2007, and the impact of increased
parts sales. Eliminating the difference in the yen value used for
translation purposes, automotive operations segment net revenues
would have been approximately ¥21,223.4 billion during fiscal
2007, a 9.7% increase compared to the prior year. In fiscal 2007,
net revenues in Japan were favorably impacted primarily by vehi-
cle unit sales growth in the export markets, which was partially
offset by changes in sales mix compared to fiscal 2006. Net rev-
enues in North America were favorably impacted by vehicle unit
sales growth and fluctuations in foreign currency translation rates
during fiscal 2007. Net revenues in Europe were favorably
impacted primarily by vehicle unit sales growth and fluctuations
in foreign currency translation rates during fiscal 2007. Net rev-
enues in Asia were favorably impacted primarily by fluctuations in
foreign currency translation rates during fiscal 2007, which was
partially offset by the impact of a decrease in vehicle unit sales.
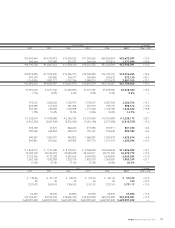
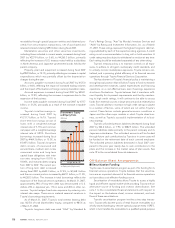
25,000
15,000
10,000
5,000
20,000
0
Net Revenues
(¥ Billion)
FY ’04’03 ’05 ’06 ’07
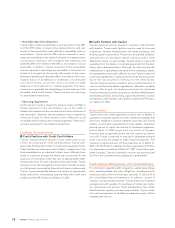
Revenues by Market
34.1%
7.1%
8.2%
36.6%
14.0%
Japan North America Europe
Asia All Other Markets
FY 2007